September 5, 2024
Every new measurement that comes in, momentarily exceeding or falling below a specified threshold cannot help understand a problem in the health of the equipment. However, when the threshold is exceeded within certain criteria and is observed repeatedly, it can be said that there is a significant problem. In order to prevent momentary threshold exceedances from causing notification pollution and to make threshold alarms in the system more noticeable, the alarm creation rules have been redesigned.
Threshold Alarms Signal Toolbox
Viewing Threshold Alarm History
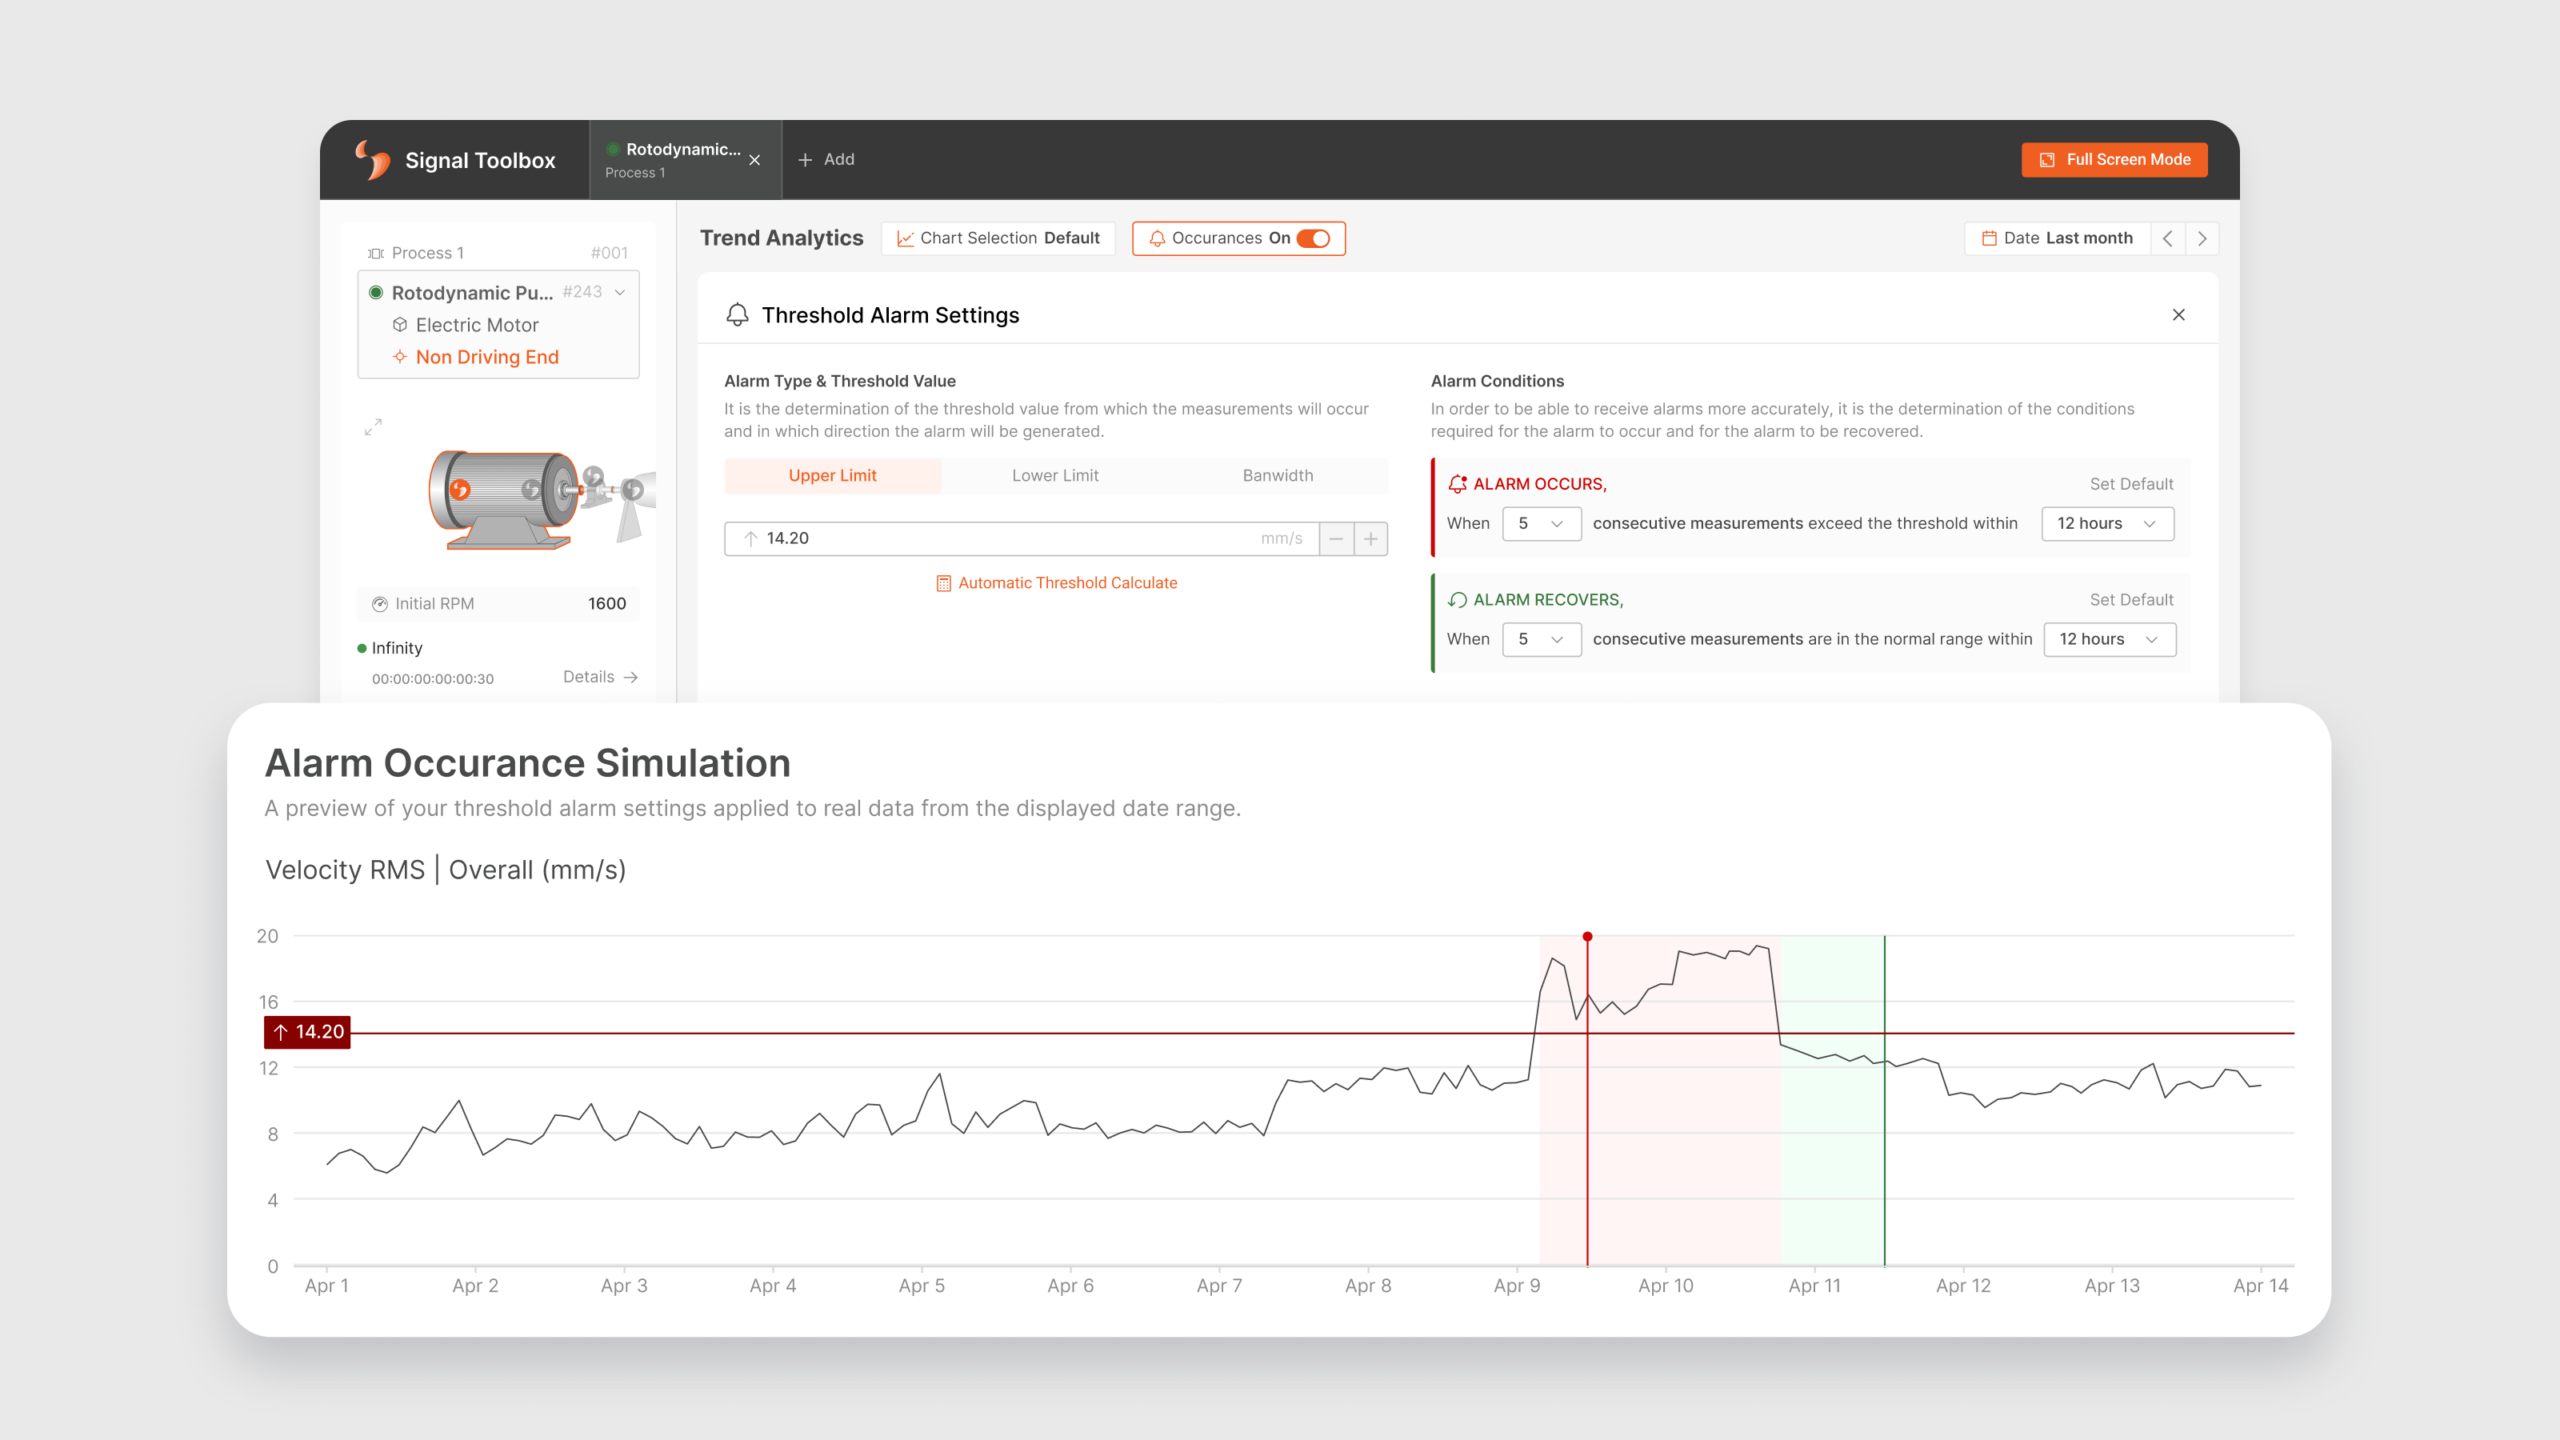
One of the most difficult information to access for a monitored sensor point was that the alarm history was not readable on the trend graph. With the new update, the measurement that caused the alarm in the system and the measurement that caused the existing alarm to recovered are marked on the graph with red and green colors (shown with number 1).
These alarm history markings can be turned off or on again by clicking the button indicated with number 2.

Setting Conditions for Threshold Alarms
Whether or not an alarm is set on the displayed data can be understood by the presence of a threshold line on the graph. In addition, next to the graph title that does not have a threshold alarm, there is the „Add Threshold Alarm“ button (shown with number 3), while next to the graph title that does have a threshold alarm, there is the „View Threshold Alarm“ button (shown with number 4).

When one of the alarm adding or viewing buttons is clicked, the chart area to which the button belongs turns into the „Threshold Alarm Settings“ area. The type of threshold alarm is determined from the field indicated by number 5. Depending on the selected alarm type, the threshold value is entered from the field indicated by number 6, or a threshold value can be calculated according to the old measurement values obtained with „Automatic Threshold Calculation“.
After the threshold value information is entered into the system, the number of consecutive measurements exceeding the threshold value and in what time period will the alarm be created in the system or the alarm will be recovered when it reaches normal levels are determined. These alarm conditions are selected by default, if desired it can be changed or the default settings can be returned (shown with number 7).
Alarm occurrence simulation is displayed on the selected date range according to the specified alarm type, threshold value and alarm conditions. By displaying how often an alarm will occur in the system according to all these rules, the most reliable alarm can be determined for the relevant sensor point by performing a critical situation analysis.
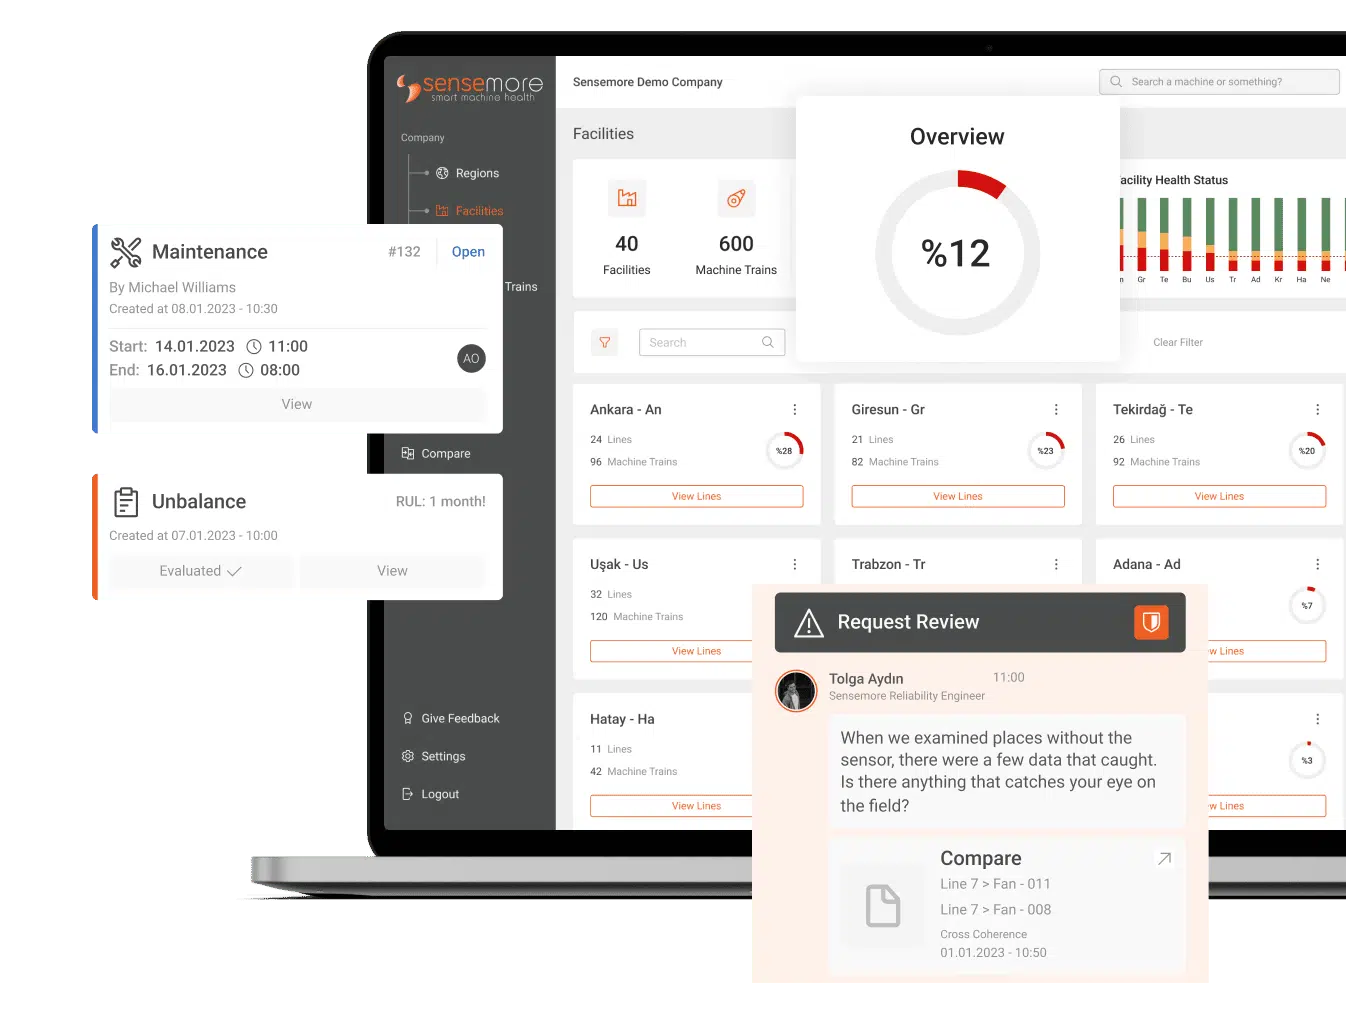
New Threshold Alarm Notifications
By determining the measurement point at which the alarm returns to normal, an information text containing the time the alarm recovered has been added to the card that appears in the chat panel.

The alarm mail design is revised to include detailed location information, alarm settings, alarm conditions and the measurement value that created the alarm for each alarm point. Additionally, an information e-mail has been integrated into the system for alarms that have returned to normal.

Discover Our Platform: LAKE
Sensemore LAKE is the reliability-focused data-driven machine health platform that offers users to create a digital maintenance culture to increase overall efficiency.