


September 5, 2024
In this product updates, the equipment selection wizard on the left panel has been arranged in a tree structure, allowing users to quickly access the desired machine train, equipment or sensor point in Signal Toolbox screen. In addition, the existing difficulties and experience in displaying different data have been improved, and a new trend display area has been added to the Signal Toolbox.
Navigation
Easy Navigation Between Assets on Signal Toolbox

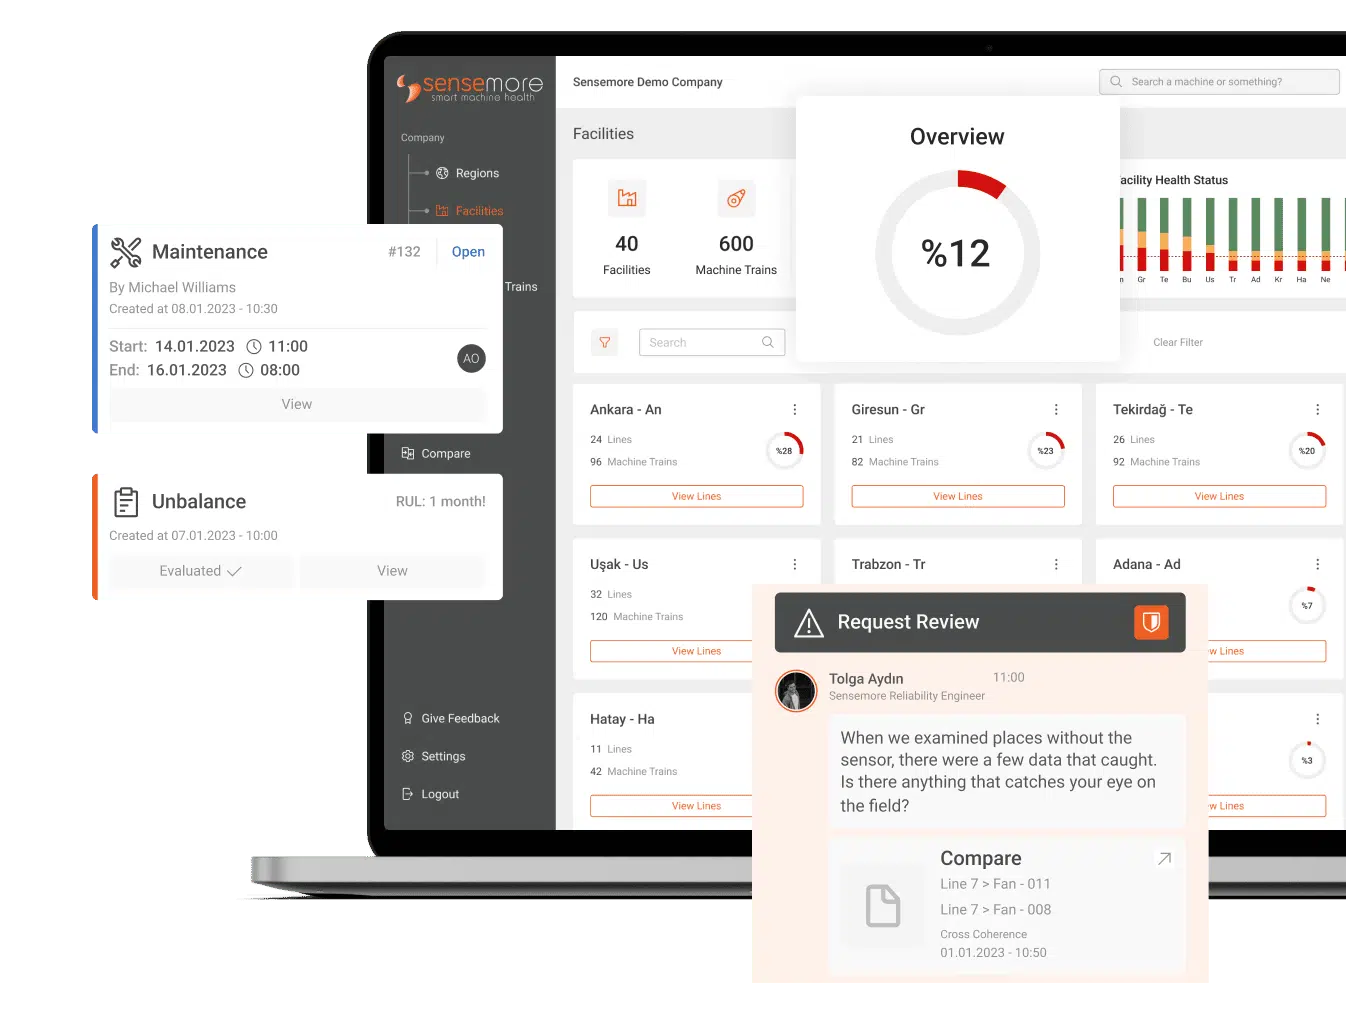
The equipment selection area design was revised with a card structure that contains the equipment, machine train, and line information to which the selected sensor point belongs hierarchically (shown with number 1). Thanks to the asset tree view in the window that opens when the card is clicked, it is now possible to easily view any sensor point in a different machine train without leaving the page when you want to change the selected sensor point.

In this asset tree selection window that opens, all machine trains in the system are listed by grouping them according to lines. The currently selected machine train and sensor point distinction can be easily read (shown with number 2).
In order to easily access the desired sensor point, especially when there are many assets in the system, a search bar has been added to the asset tree window, which allows only machine train searches (shown with number 3).
Signal Toolbox
A New Approach to Viewing Data Trends
In the old trend display area, although there was a lot of data obtained from sensors, the experience of viewing this data was both multi-step and only allowed viewing 4 types of data at a time.
With the Trend Analytics screen, the 2 type of data monitored by default for each sensor point are automatically displayed on the screen, and when the „Chart Selection“ button is clicked, the desired data can be brought directly to the screen with just one click thanks to the selection window that opens (shown with number 4). In particular, the difficulty in viewing the calculations of the same data on different axes is eliminated with the „All“ option in the opened sub-window.
If the charts that were first opened are to be returned to, it is enough to click the „Set Default“ button in the chart selection window that opens.

In the „Trend Analytics“ screen, where the last month’s data comes by default in the first display, and the date range can be selected from the button (shown with number 5) in the upper right corner. In addition, the previous or next period of the displayed date range can be quickly viewed with the arrows next to the button.

When you hover over any chart, the data of all charts displayed on the screen for the date hovered over can be read synchronously in the same data card (shown with number 6). In addition, when you click on the desired measurement point, you can easily access the Signal Analysis tab for detailed signal viewing.
Discover Our Platform: LAKE
Sensemore LAKE is the reliability-focused data-driven machine health platform that offers users to create a digital maintenance culture to increase overall efficiency.