

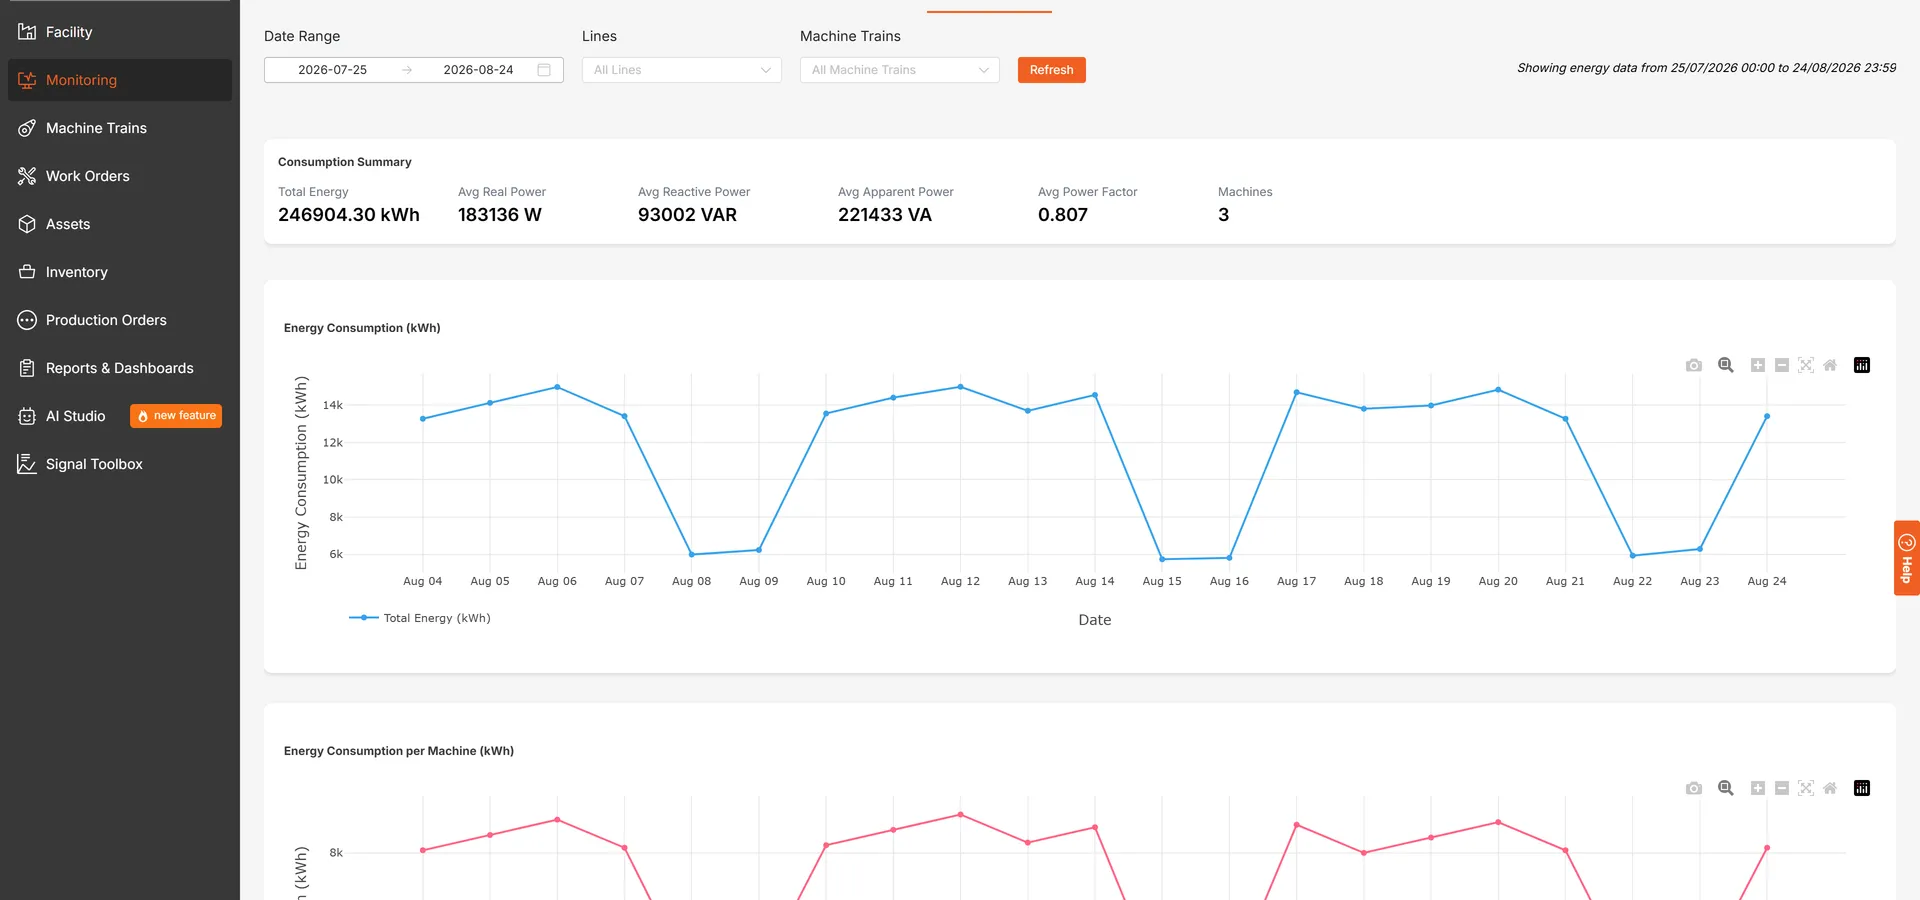
Energy Monitoring puts consumption, power and power quality on one page, per machine and per line. Alongside it, current is measured on the same sensor point as vibration, so the electrical side of a motor and the mechanical side sit in the same platform rather than in two.
What the Page Holds
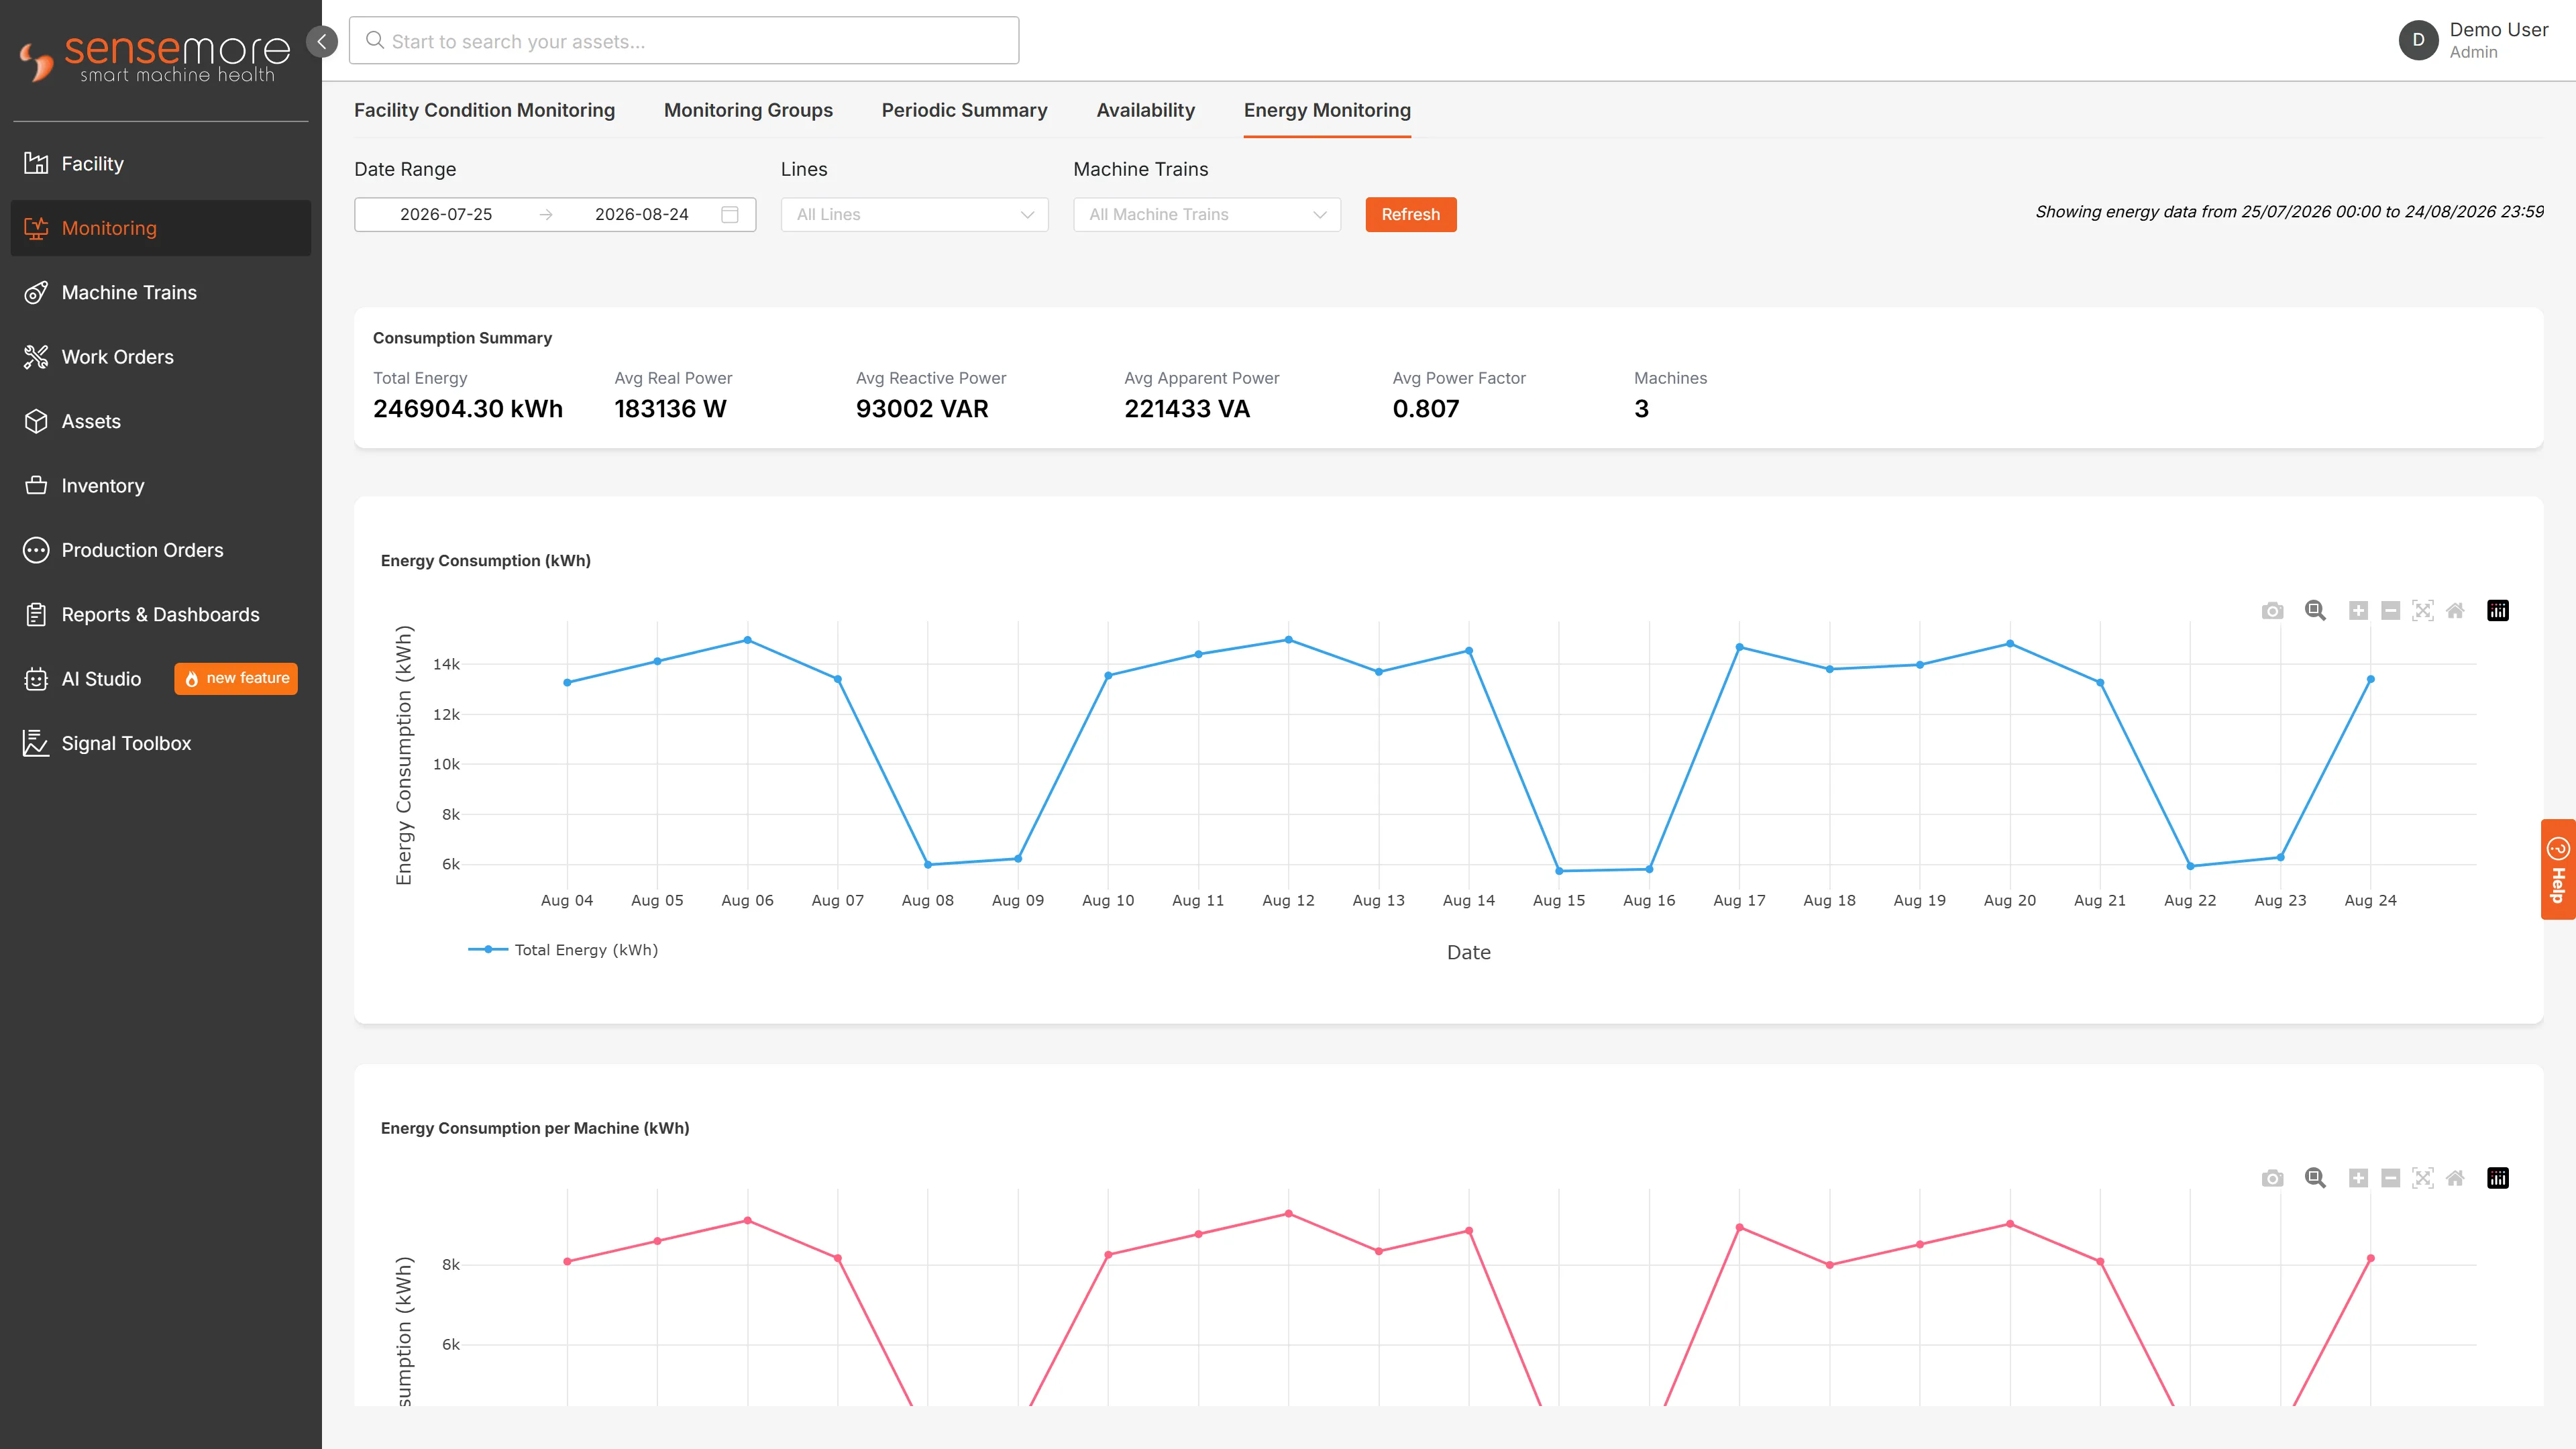
Consumption in kilowatt hours for the period you choose, and the power figures behind it: real power in watts, reactive power in VAR, apparent power in VA, and the power factor. Average, minimum and maximum power are given as well, because a plant that averages comfortably can still be tripping breakers at its peaks.
Consumption is charted per machine train, so several machines can be set against each other over the same period, and the view filters by production line as well. Quick ranges cover this week, this month, the last seven days and the last thirty.
Power Factor in Words, Not Only in Numbers
A poor power factor means current is being drawn that does no useful work: it costs money on the bill and heats cables and windings for nothing. The platform rates power quality as good, fair or poor rather than leaving a bare figure on the screen, so the page is readable by the person who opens it rather than only by an electrical engineer.
Current, Beside the Vibration
A motor tells you about itself twice, once through how it shakes and once through what it draws. Current is measured on the same sensor point as vibration, phase by phase, and trended as RMS, peak and peak-to-peak values that can be alarmed like any other measurement.
Having both on the same point matters more than having either. A change in current without a change in vibration, or the other way round, narrows down what is happening long before anyone opens a terminal box.
Where Energy Meets Maintenance
Cost is the obvious use, and it is a good one. But consumption that drifts upward while output stays flat is a symptom, and it often appears before vibration does. The same history answers the questions that usually get argued: what an idling line costs, which machine is worth scheduling at night, and whether last month’s repair actually changed anything.
Where to Find It
Energy Monitoring is its own page, and the headline figures also appear on the facility overview and in monitoring, next to availability.
Frequently asked questions
What does Energy Monitoring show?
Consumption in kilowatt hours over the period you choose, real power in watts, reactive power in VAR, apparent power in VA and the power factor, with average, minimum and maximum power alongside. Consumption is broken down per machine train, so the question of which machine is drawing the most has an answer rather than an opinion.
Why does power factor matter to a maintenance team?
Because a poor power factor means a plant is drawing more current than the work requires, which costs money on the bill and heats cables and windings for nothing. The platform rates it as good, fair or poor rather than leaving a bare number, so it is readable by whoever opens the page and not only by an electrical engineer.
Can energy be compared across machines and lines?
Yes. The view filters by production line and by machine train, and energy consumption is charted per machine so several can be set against each other over the same period. Quick ranges for this week, this month, the last seven days and the last thirty days are there for the comparisons people actually make.
How does current relate to vibration monitoring?
Current is the second window onto a motor. It is measured on the same sensor point as vibration, phase by phase, and trended as RMS, peak and peak-to-peak, so an electrical change and a mechanical one can be looked at side by side instead of being chased through two separate systems.
Does energy data help with maintenance, or only with cost?
Both. Cost is the obvious use, but a machine whose consumption drifts up while its output stays the same is telling you something, and that pattern often shows before vibration does. Energy history also settles arguments about which equipment to schedule when, and about what an idling line actually costs.