

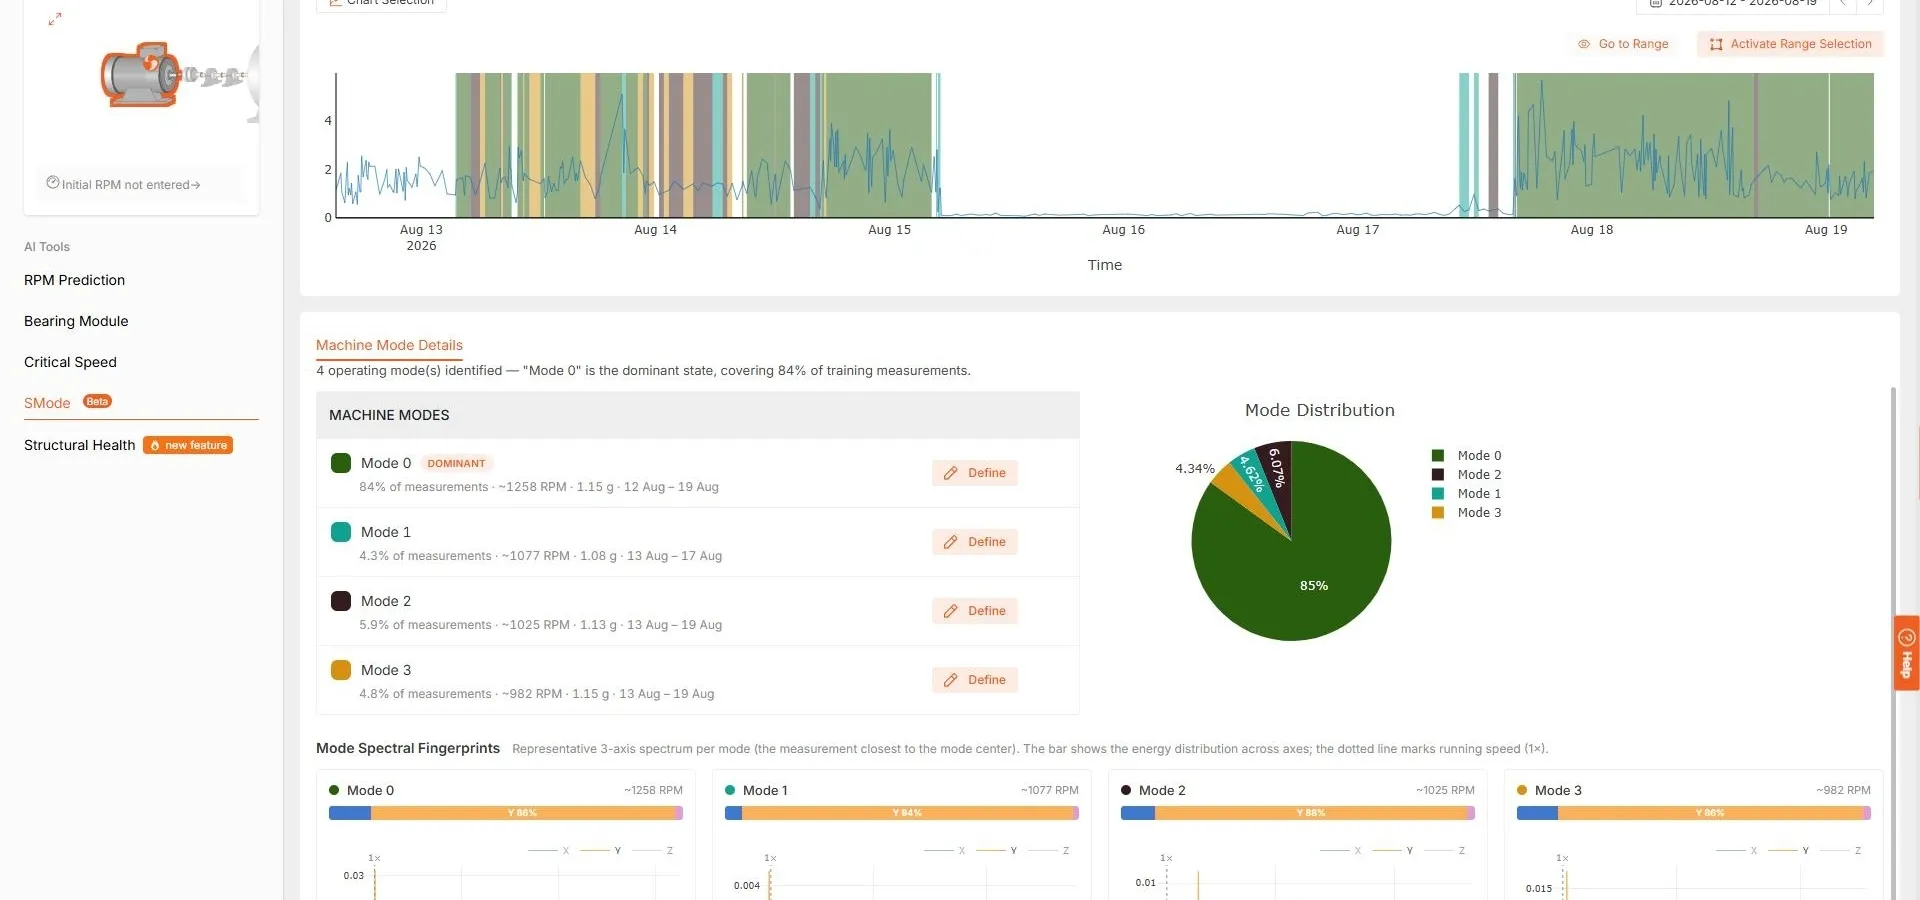
S-Mode now gives you a baseline in one click, and reports what it found in plain numbers. A model built from a machine’s recent measurements says how many operating modes it identified, which one the machine spends most of its time in, and what each mode looks like, with a spectrum per mode taken from a real measurement rather than an average.
A Baseline in One Click
Quick Train builds a model from the last seven days of measurements without asking you to choose date ranges or decide in advance how many modes there should be. The model reports its progress as it works, and moves through queued, processing and ready, so you can start one and go and do something else.
Building a model by hand, picking the date ranges to include and excluding the periods you know were unusual, still works exactly as it did, and is the right approach when you know something about the period that the data does not show. Quick Train is for the common case: you want to know what this machine has been doing lately.
How Many Modes, and Which One Dominates
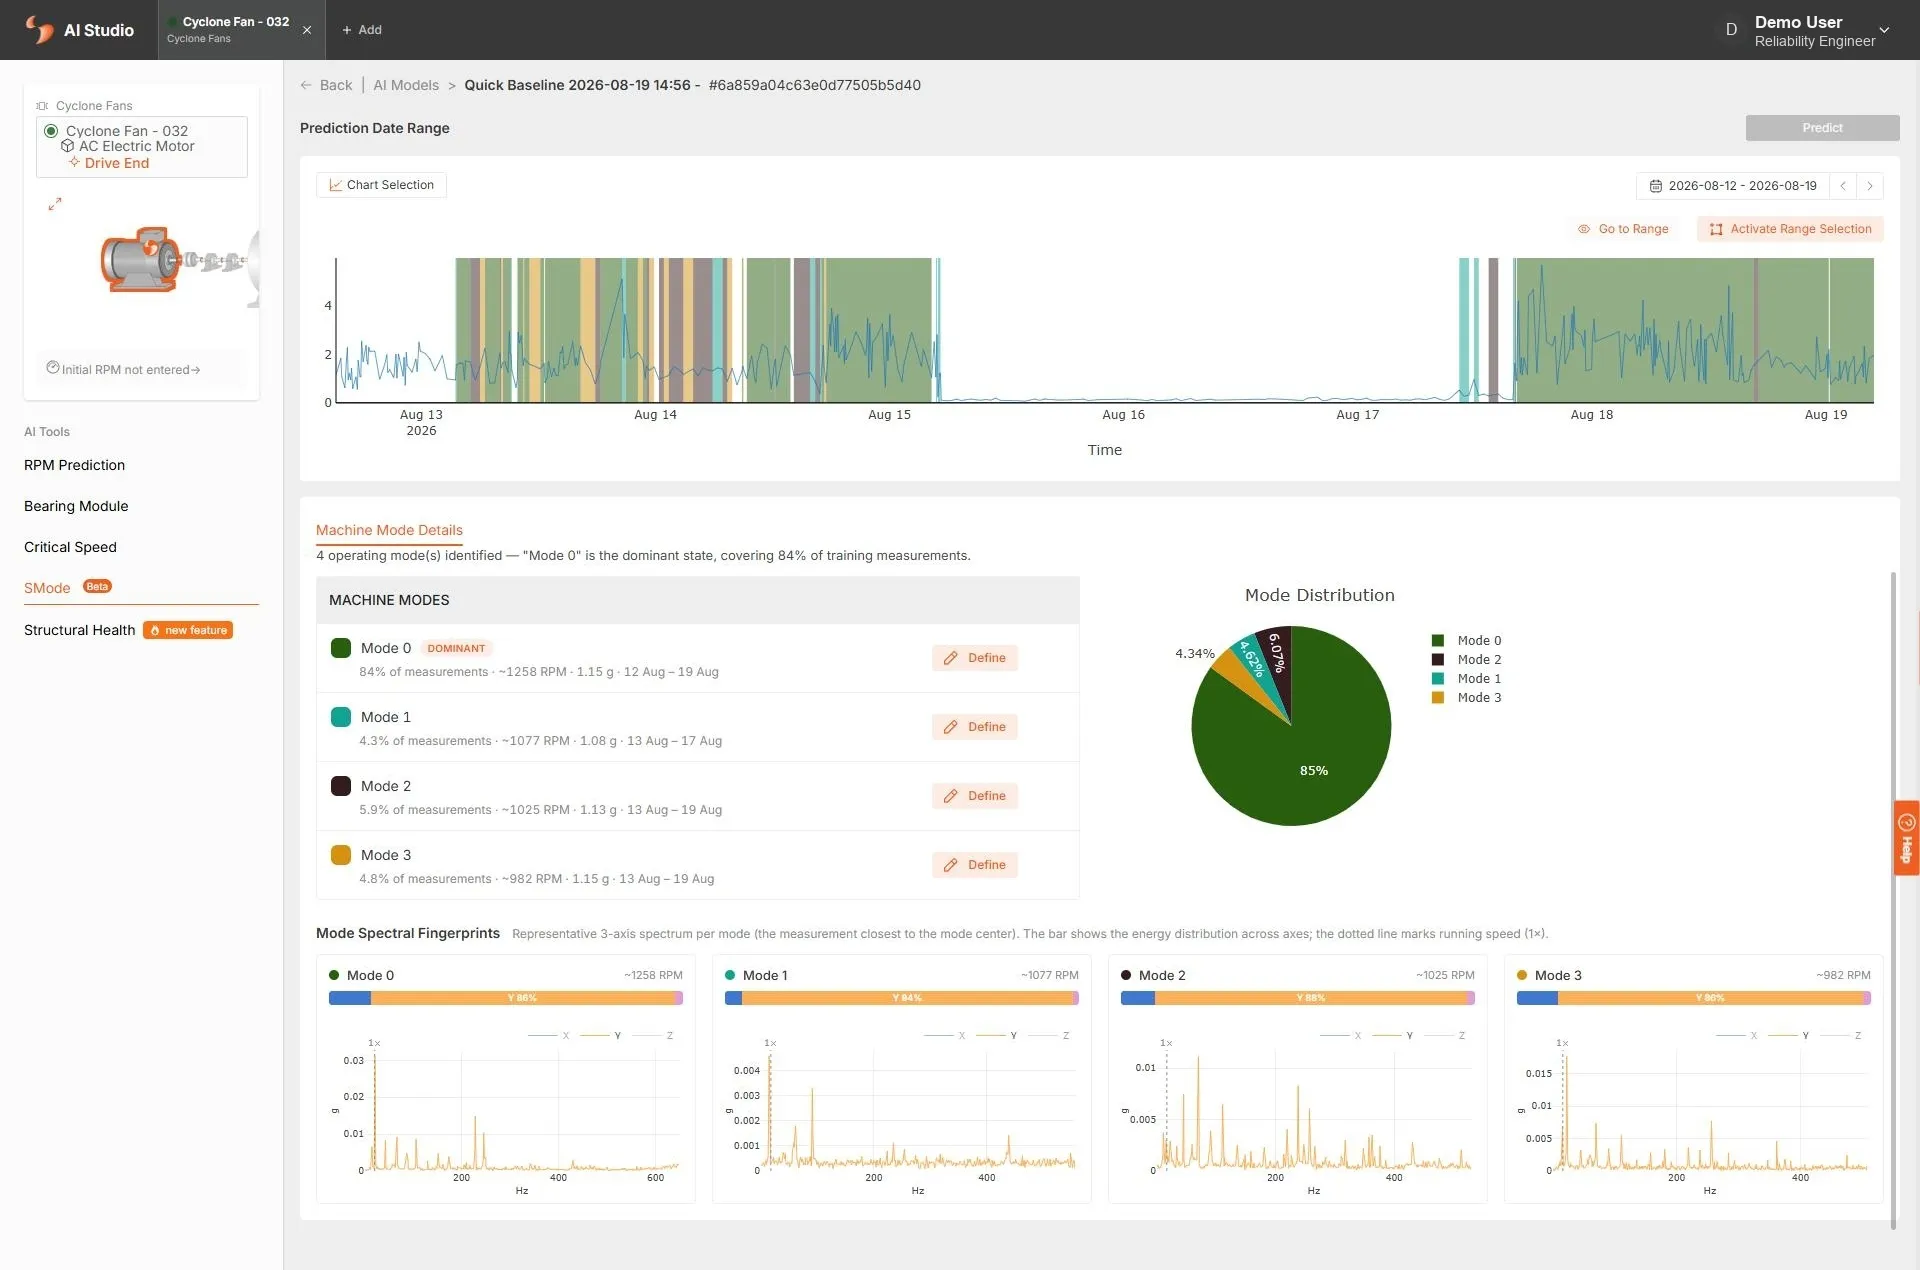
When the model is ready it says what it found in a sentence: how many operating modes there are, and which one is the dominant state. It then lists them. Each mode carries its share of the measurements, its typical running speed, its typical vibration level and the days it appeared on. A distribution chart puts the same thing in proportion at a glance.
Each mode can be renamed, so the model reads in the plant’s own vocabulary rather than as Mode 0, Mode 1 and Mode 2.
A Fingerprint for Every Mode
Underneath the mode list, every mode gets a representative three-axis spectrum, taken from the measurement closest to the middle of that mode: a real measurement, not a composite. Running speed is marked on it, and a bar above shows how the energy divides across the three axes.
That last part matters more than it sounds. Two modes can sit at a similar overall vibration level and still be different states of the machine; where the energy sits, and how it is spread across the axes, is often what separates them.
Matched, or Set Aside
New measurements are matched to the mode they belong to. A measurement that matches nothing is flagged for review rather than pushed into the nearest mode. The modes keep meaning what they say, and a genuinely new behaviour reaches a person instead of disappearing into an existing state.
A measurement whose running speed could not be established is set aside, with the reason given. It is not reported as an anomaly: a gap in what we know about a machine and a change in the machine itself are different things, and a maintenance team should not have to spend a morning finding out which one it was looking at.
Where to Find It
S-Mode is in AI Studio, alongside RPM Prediction, the Bearing Module, Critical Speed and Structural Health. There is a summary of what a machine mode model produces on the Machine Health AI page.
Frequently asked questions
What is a machine mode in Sensemore AI Studio?
A machine mode is one of the states a machine actually runs in: full load, part load, idle, a particular product or line speed. S-Mode learns them from the machine's own recent measurements rather than from a rule someone types in, and then reports how many it found, which one the machine spends most of its time in, and what each of them looks like.
How long does it take to get a baseline?
Quick Train builds one from the last seven days of measurements in a single click. The model shows its progress while it works and moves through queued, processing and ready, so you can leave it and come back; there is no need to pick date ranges or set a number of clusters first. A model built by hand, over date ranges you choose yourself, is still available when you want that control.
What does a spectral fingerprint show?
For every mode, a representative three-axis spectrum taken from a real measurement rather than an average: the one closest to the middle of that mode. Running speed is marked on it, and a bar alongside shows how the energy divides across the three axes, so two modes at a similar overall level can still be told apart by where that energy sits.
What happens to a measurement that does not match any mode?
It is flagged for review instead of being pushed into the nearest mode. That keeps the modes meaning what they say, and it puts a genuinely new behaviour in front of a person rather than hiding it inside an existing state. Modes you care about can also raise a notification, so a machine moving into one of them reaches you without anybody watching the screen.
Can machine modes be given proper names?
Yes. Each mode can be renamed from the mode list, so a model reads as the plant's own vocabulary ("full load", "start-up ramp", "recirculation") rather than as Mode 0, Mode 1 and Mode 2. Named modes carry through to the notifications and to the machine train timeline, which is what makes them useful to somebody who did not build the model.