February 5, 2024
With significant enhancements made in our Signal Toolbox, one of our most critical tools for data analysis, we’ve elevated the user experience, making data analysis more user-friendly and efficient.
Signal Toolbox
Easy Access to Significant Data
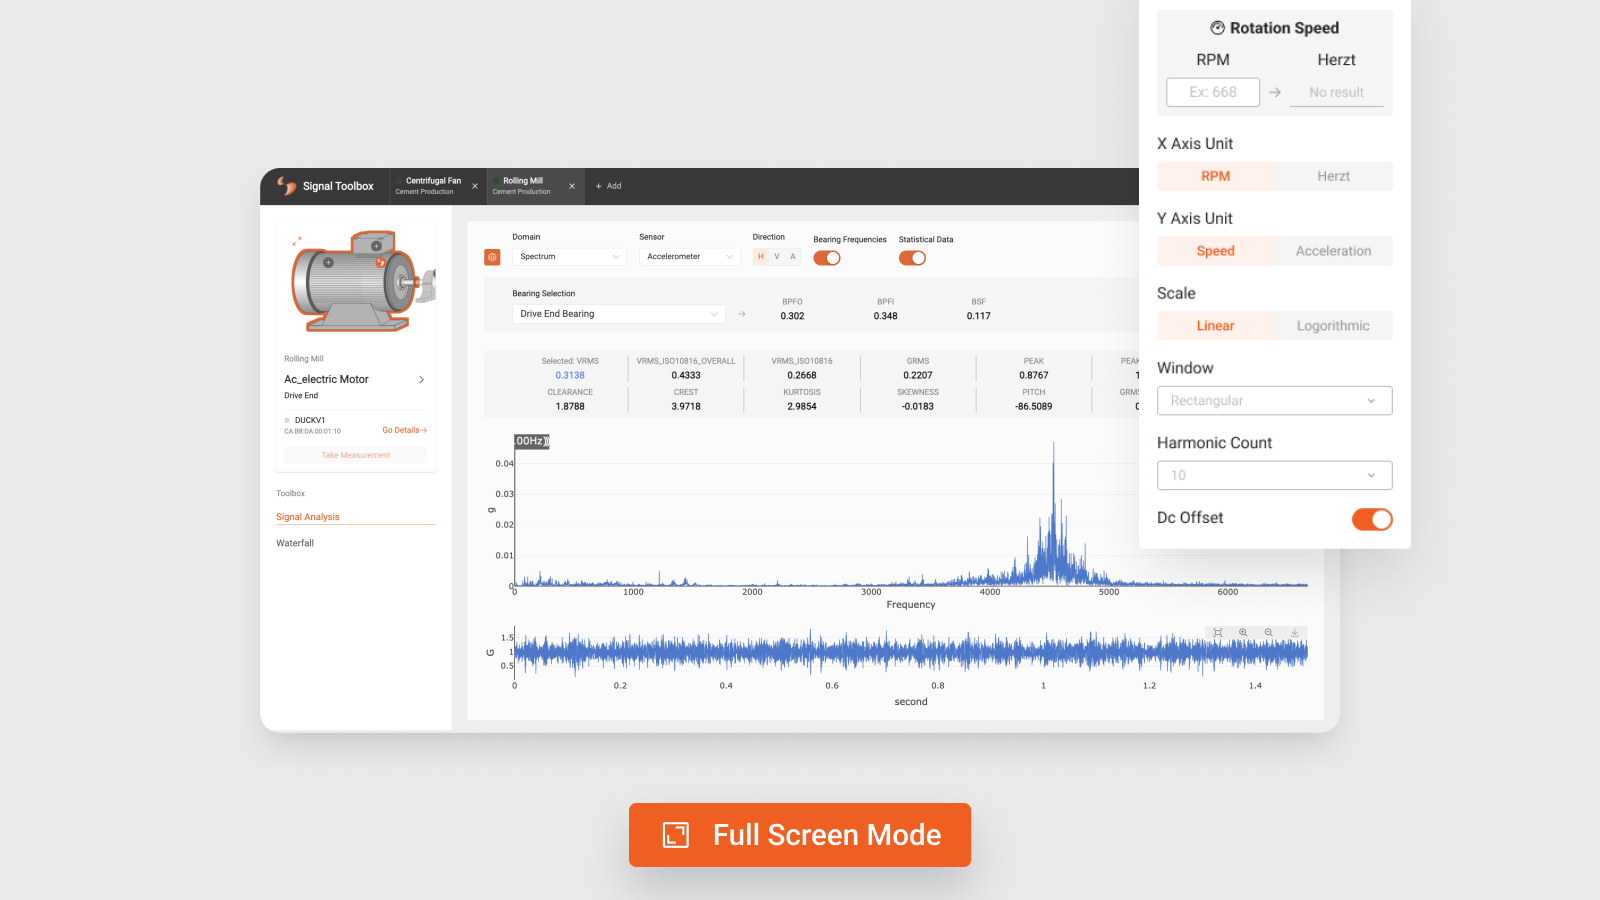
Since bearing frequencies have an important place in data analysis, we removed this area from the advanced settings panel (shown with 3) and made it an easily accessible area (shown with 1). Additionally, if you have entered your bearing data, the bearing in the sensor place you selected will be automatically selected and all you have to do is enter the rotation speed of your machine from advanced settings panel.
You can review other statistical data (shown with 2) regarding the measurement you selected by opening the toggle button in your signal settings area.
Automatic RPM Translation
We revised the RPM entry field (shown with 4) in the Advanced settings area both in terms of UI and added a feature that automatically converts the Hertz equivalent of the RPM value you enter. You will no longer need to do calculations to know your reference value according to the unit in which you display your signal!
We also included the panel for editing the number of harmonics (shown with 5), so that you can more easily access the analysis settings that are more important to you. If you want to change the number of harmonics you want to display on the chart, your place is now in the advanced settings panel.
Device Connection Information
In our equipment wizard located in the Signal Toolbox area, if a device is connected to the sensor place you selected, you can now understand whether that device is connected or not from the green and gray dot icon (shown with 6) at the beginning of the device name information. If you view any connection problems, just click the Go Details button to get more information.
Full Screen for Better Analysis
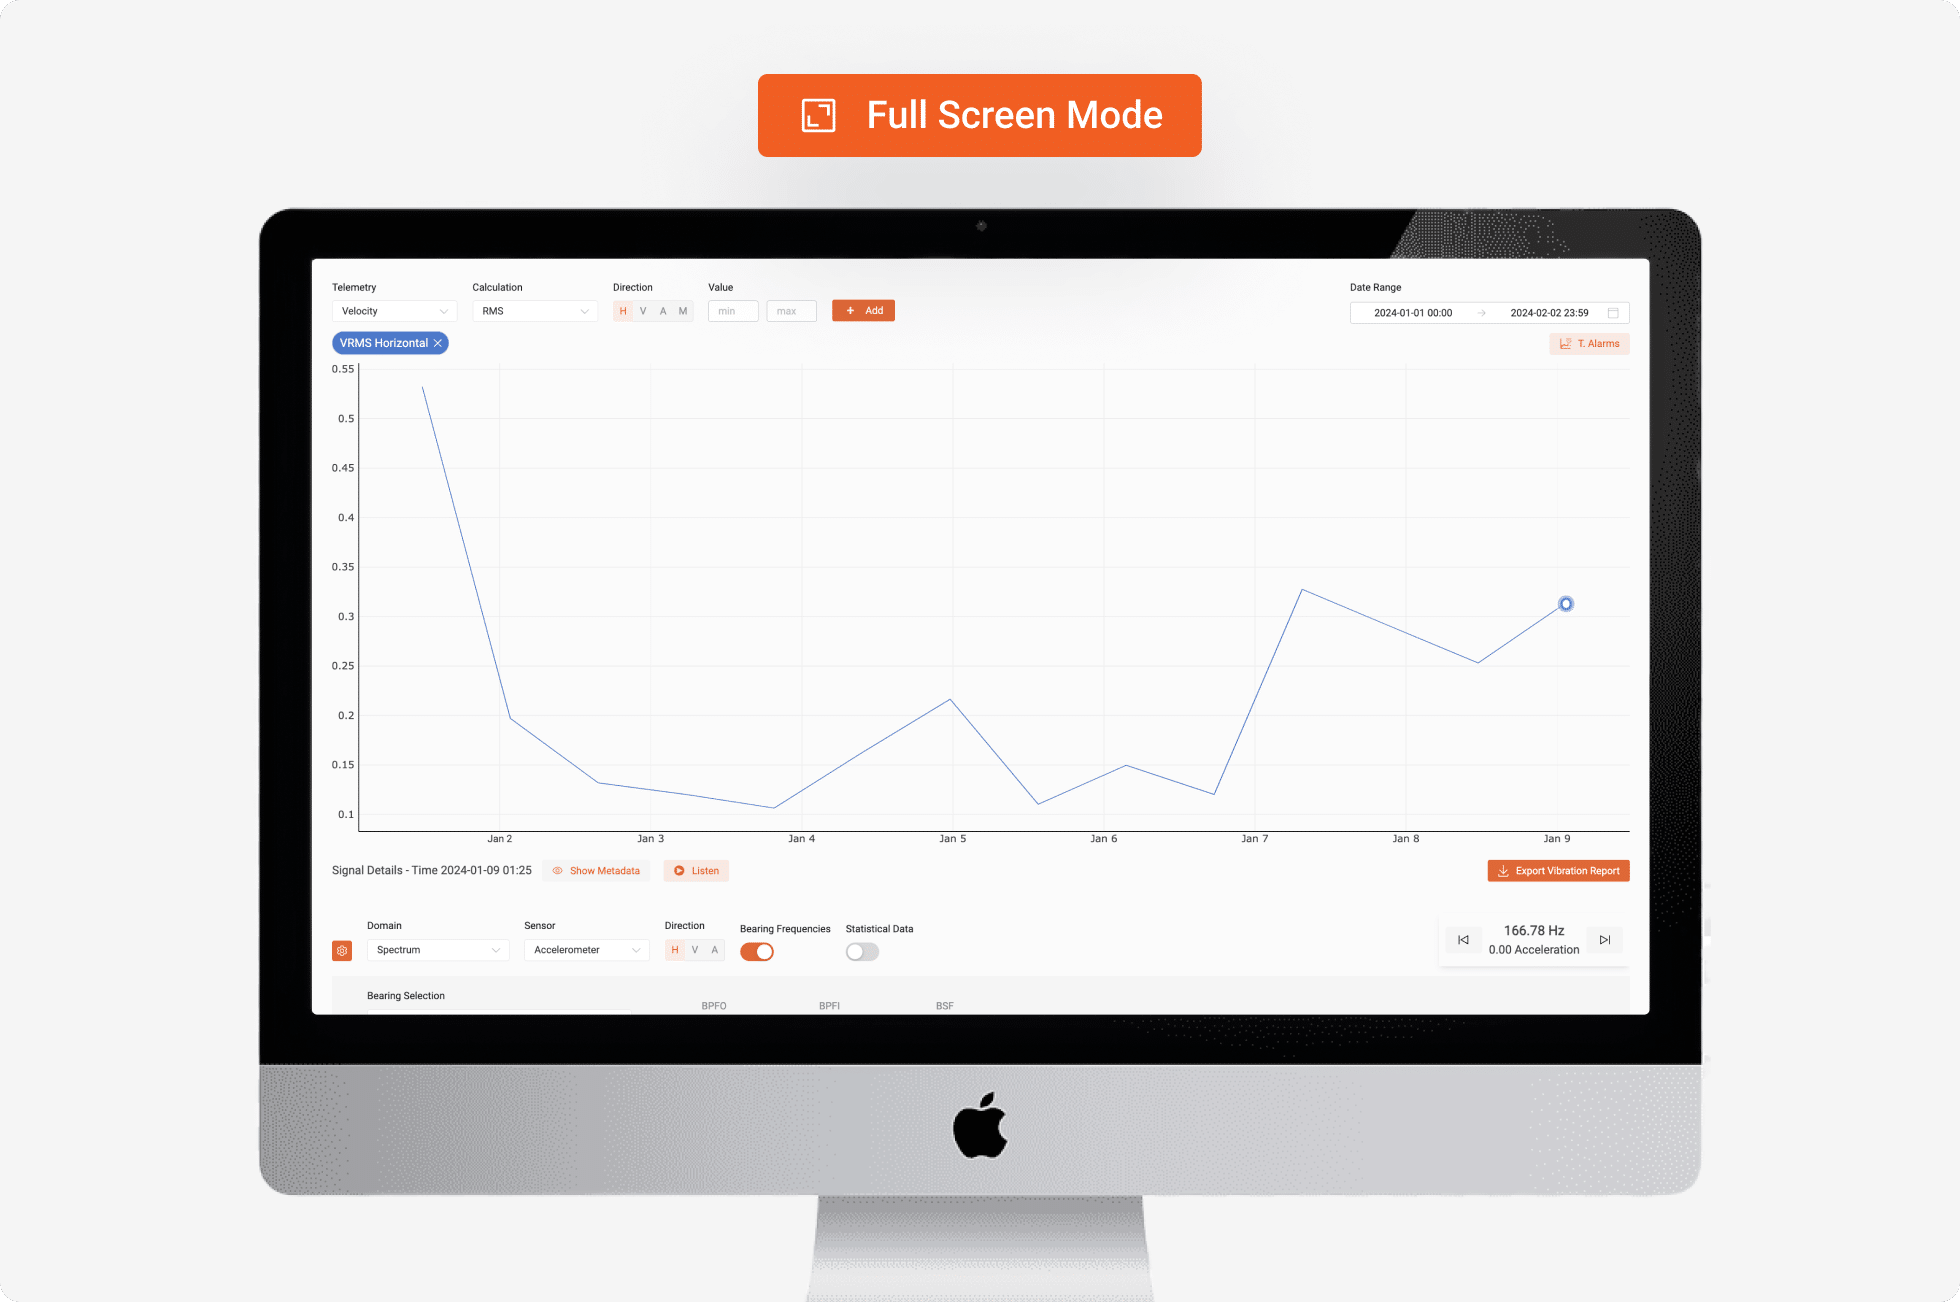
We know how detailed data analysis is and how difficult it is when you want to view a lot of data. For exactly these reasons, we introduced Full Screen Mode to our Signal Toolbox area. You can review your data in full screen by clicking the button at the top right of the page. To exit, simply press the Escape key on your keyboard. It’s that simple!
Discover Our Platform: LAKE
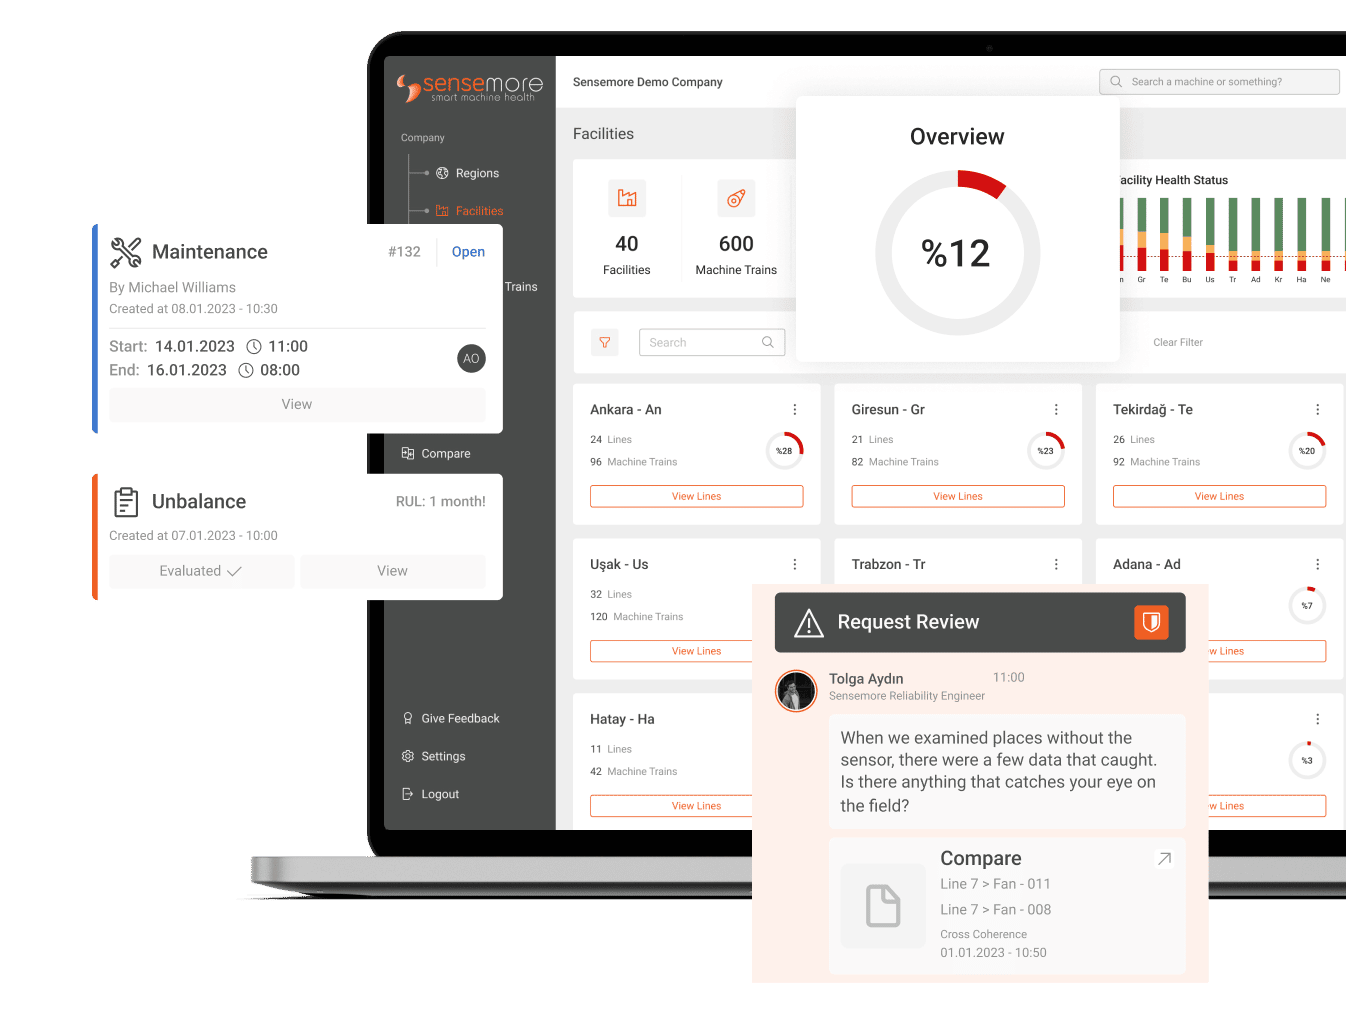
Sensemore LAKE is the reliability-focused data-driven machine health platform that offers users to create a digital maintenance culture to increase overall efficiency.


