

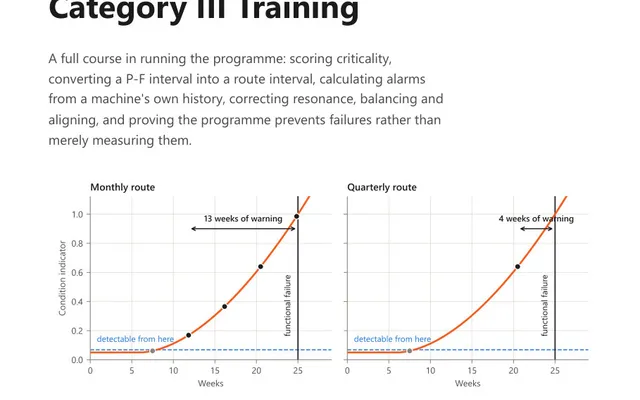
Vibration Analysis Training: Category III
A 56-page course book on running the programme: criticality scoring, the P-F interval, and alarms calculated from the machine's own history, not a table.
MTBF is operating hours divided by the number of failures, MTTR is the total repair hours divided by that same number, and availability is MTBF divided by MTBF plus MTTR. Three divisions and one period of history, and every one of them depends on how carefully that period was recorded.
Take a window of time, the running hours inside it, the failures inside it and the hours spent putting those failures right:
The failure rate is nothing more than the reciprocal of MTBF. It is quoted per million hours because the raw reciprocal of a few thousand hours is an awkward decimal, and because component data is published that way, so a rate per million hours can be set beside one.
The most common way to get MTBF wrong is to divide the calendar by the failures. A pump that stood idle for half the quarter did not accumulate that time, because a machine only wears while it turns. Take the hours from a run signal, a motor current record or an hour counter. Where none of those exists, fitting one is worth more than the calculation is.
MTTR runs from the machine stopping to the machine running again, added up across every failure. That includes waiting for a fitter, waiting for a part, the paperwork and the recommissioning, and not only the time somebody had a spanner in their hand. The two can differ by an order of magnitude, and the longer one is what the plant actually lost. A short wrench time buried inside a long MTTR is a spares and logistics problem rather than a maintenance skill problem, which is a useful thing to be able to show.
Availability describes the past. The reliability figure asks a forward question: given this MTBF, what are the odds of getting through the next run without a stop?
R = exp(−mission time / MTBF)
Mission time is whichever run matters: to the next planned shutdown, through one order, across a month.
That formula carries an assumption the other three do not. It holds only where the failure rate does not change with age, which is the flat middle of the bathtub curve. It does not describe wear-out, and it does not describe the infant mortality that follows an overhaul, when new parts, disturbed joints and fresh assembly errors put a machine back at the left of the curve. A rotating machine late in its life sits in neither region. Use the percentage to compare options against each other rather than to promise anybody a date.
MTBF is for repairable assets and counts the running time between one failure and the next. MTTF, mean time to failure, is for items that get replaced rather than repaired: a bearing, a lamp, a filter element. The two get used interchangeably and they answer different questions. One describes a machine that gets fixed and put back, the other a part that gets thrown away.
MTBF is a mean, and a mean says nothing about the shape behind it. A pump that fails every 2000 hours like clockwork and a pump that runs 8000 hours twice and then fails three times in a fortnight can report the same MTBF, and they need entirely different work. The first is a wear problem with a predictable interval and a case for a scheduled change. The second is a cluster of related events, and averaging them away is how the pattern gets lost.
So read the intervals before deciding what the average means. Where they are all similar, the mean describes the asset. Where they are scattered, the mean describes nothing anybody can plan around.
The availability here counts repair time against running time. It answers whether the asset is there when it is called for, and that is all it answers. It says nothing about running slower than the nameplate or about making product that has to be scrapped, and both of those cost output as surely as a stop does. Where the question is how much the line actually produced, availability is one term of three rather than the answer.
A machine ran 8000 hours in the period and failed four times. The four repairs took 26 hours in total, counted from stop to restart. The next order needs 720 hours of running.
Set the last two lines next to each other and the useful tension appears. Availability is 99.68 percent, which reads like an asset in excellent health, while the chance of getting through the next order without a stop is a little under seven in ten. Both are true. Availability is high because the repairs are quick and not because the failures are rare, and a 720 hour run is long next to a 2000 hour mean.
That gap is where the maintenance decision sits. Pushing availability higher means shortening the repairs, and there are only 6.5 hours left to work with. Improving the odds of a clean run means fewer failures, which is different work on a different timescale. The two numbers point at two departments, and reading both is what keeps the argument honest.
Divide the hours the asset was actually running by the number of failures in the same period. An asset that ran 8000 hours and failed four times has an MTBF of 2000 hours. Two things decide whether the answer means anything: the hours must be running hours rather than calendar hours, and a failure must be defined the same way every time it is counted.
MTBF, mean time between failures, is for repairable assets and counts the running time between one failure and the next. MTTF, mean time to failure, is for items that are replaced rather than repaired, such as a bearing or a lamp. The two are often used interchangeably and they answer different questions: one describes a machine that gets fixed, the other a part that gets thrown away.
Availability is MTBF divided by MTBF plus MTTR, which is the share of the repair and run cycle the asset spends running. An MTBF of 2000 hours with an MTTR of 6.5 hours gives 2000 divided by 2006.5, or 99.68 percent. It answers whether the asset is there when it is called for, and it says nothing about running slowly or making scrap.
It assumes the failure rate does not change with age, which is the flat middle of the bathtub curve. The figure is the exponential of minus mission time divided by MTBF, so an MTBF of 2000 hours gives about 69.8 percent over a 720 hour run. It describes neither wear-out nor the infant mortality that follows an overhaul, so treat it as a rough comparison between options rather than a forecast.
No. Dividing by zero failures gives nothing, and the period supports only one honest statement: the mean time between failures is longer than the period itself. Keep recording operating hours and let the number arrive when it has something to be computed from. A mean built on one or two failures is thin in the same way, so read the intervals between failures rather than the average alone.
The calculator gives you the number. These course books explain what the number means and how the measurement that produced it should be taken.
A 56-page course book on running the programme: criticality scoring, the P-F interval, and alarms calculated from the machine's own history, not a table.
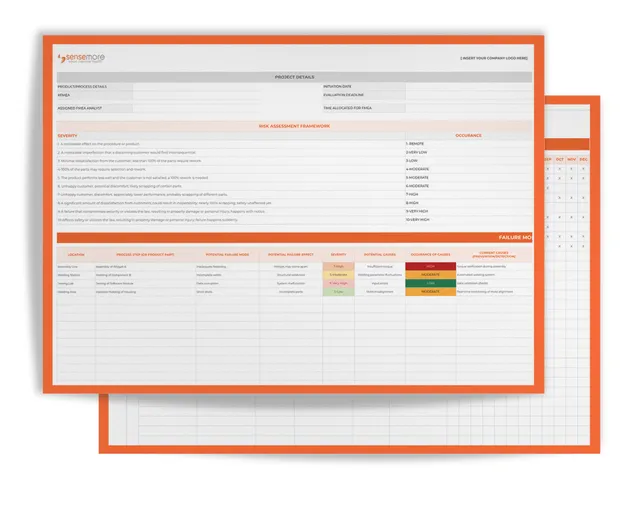
Upgrade your maintenance strategy with our Reliability Focused Maintenance Plan Template, comprehensive approach to failure analyses