

Vibration Analysis Training: Category III
A 56-page course book on running the programme: criticality scoring, the P-F interval, and alarms calculated from the machine's own history, not a table.
The longest safe inspection interval is the P-F interval minus your response time, divided by the number of detections you want inside the window. Two numbers go in that most programmes never write down, and the second of them is the one that decides whether the first is any use.
It is not how long the machine lasts. It is how long the warning lasts: the time between the first detectable sign of a fault and the point at which the machine can no longer do its job. A pump that runs for eleven years and then gives six weeks of notice has a P-F interval of six weeks, not eleven years. The two figures answer different questions, and only the second one has anything to say about how often to measure.
That definition has a consequence worth sitting with. A technique that detects earlier gives a longer P-F interval on exactly the same failure. Nothing about the bearing changed; the moment at which its condition became visible moved earlier, and the warning grew. This is the whole argument for vibration analysis over listening, and for envelope analysis over an overall level.
Three inputs and two operations.
The units only have to be consistent, because they divide out. Hours, days, weeks or months all give the same answer as long as both inputs are expressed in the same one.
The subtraction is the step that gets skipped. Response time is everything between a finding and the repair being done: confirming the diagnosis, deciding it is real, ordering the spare, waiting for it, planning the work and waiting for a window in which the machine can be stopped. None of that time is available for detecting anything. A programme that divides the whole P-F interval instead of what is left of it is measuring often enough to be surprised on schedule.
Measuring once per usable window means the fault has to appear immediately after a route to be caught before failure, and about half of them will not oblige. Two measurements inside the window guarantee that one falls inside it, which is why two detections is the usual minimum.
Three is the setting for a programme that loses routes. A machine is running a critical batch and cannot be touched, the analyst is on another site, a shutdown swallows a week of the schedule. Three detections leave room for one of those to happen without the fault being lost with it. The cost is a shorter interval and more work, which is exactly the trade being made.
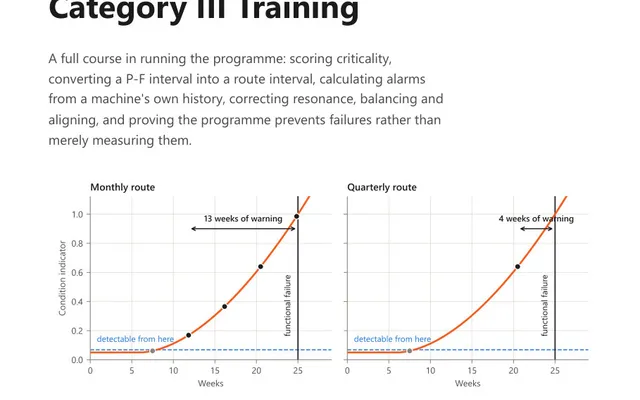
The same bearing gives months of warning to a spectrum, weeks to an oil sample, days to the ear and hours to a hand on the housing. These are not competing measurements of the same thing. They sit at different points on the same curve, and each one carries its own P-F interval for the same failure.
The practical consequence is that choosing an interval means first choosing which point on the curve you intend to be standing at. Put the spectrum on a monthly route and the hand on the housing on a daily walk and both are being used at roughly the right rate. Swap them and neither is: the daily walk is wasted on a fault it will meet far too late, and the monthly spectrum is being asked to do a job that a walk could have done.
If the response time is longer than the P-F interval, the usable window is zero or negative and the division has nothing left to work with. By the time a finding could be acted on, the machine would already have failed. Measuring more often does not fix that, and neither does a better sensor.
There are two ways out. Either the response gets shorter, through a spare held on the shelf, a standing plan that does not have to be invented on the day, or a decision made in advance about who can authorise the stop. Or the technique changes for one that detects earlier and gives more warning to work in. Any programme with a failure mode in this state is running to failure whether or not it says so.
A failure mode with a P-F interval of 6 months, a response time of 1.5 months, and two detections wanted.
So a route that visits this machine every two months sits inside the limit. A monthly route fits 4.5 detections into the usable window, comfortably clear of the target. A quarterly route fits only 1.5, which means a fault can appear and reach failure between two visits, and a quarterly route is a very common answer to a machine like this.
The example also shows where the leverage is. Halving the response time to 0.75 months lifts the usable window to 5.25 months and the maximum interval to 2.625 months. Holding one spare bought more inspection interval than any change to the measurement did, and it cost nothing to measure.
Every figure above rests on the P-F interval that went in, and that is usually an estimate. Published tables exist and they describe somebody else’s machines, duty and environment.
Where a plant has failure history, that history is the better source, because it already contains the machines you actually own. A programme that records two dates for every failure, the day the first sign appeared and the day the function was lost, builds its own P-F intervals within a year or two and stops guessing. That record costs one line in a report and it is the only way the number ever becomes yours.
It is the length of the warning a failure gives, not the length of the machine's life. The P-F interval runs from the first moment a fault can be detected to the moment the machine can no longer do its job. A machine that runs for years and then gives six weeks of notice has a P-F interval of six weeks. Only that second number decides how often anyone needs to go and look at it.
In two steps. First subtract the response time from the P-F interval, because the part of the warning spent on diagnosis, spares, planning and waiting for a shutdown is not available for detecting anything. What is left is the usable window. Then divide the usable window by the number of detections wanted inside it, normally two. The result is the longest interval between measurements that still works.
Because measuring once per window means the fault has to appear immediately after a route to be caught before failure, and roughly half of them will not oblige. Two measurements inside the usable window guarantee that one of them lands after the fault becomes detectable and before the machine fails. Three is worth choosing where routes get missed, since it gives back the visit lost to an unavailable machine or an absent analyst.
Then no measurement frequency helps. By the time a finding could be acted on, the machine would already have failed, so the usable window is zero or less and dividing it produces nothing worth having. There are two ways out and neither is measuring more often. Either the response gets shorter, through a spare held on the shelf or a standing plan, or the technique changes for one that detects earlier.
Because they sit at different points on the same curve rather than competing to measure the same thing. The same bearing gives months of warning to a spectrum, weeks to an oil sample, days to the ear and hours to a hand on the housing. A technique that detects earlier lengthens the warning without changing anything about the bearing, which is the entire argument for vibration analysis over listening.
The calculator gives you the number. These course books explain what the number means and how the measurement that produced it should be taken.
A 56-page course book on running the programme: criticality scoring, the P-F interval, and alarms calculated from the machine's own history, not a table.
42 practice questions on running a vibration programme, from criticality and the P-F interval to alarm arithmetic, each answer worked rather than lettered.