

Vibration Analysis Training: Category III
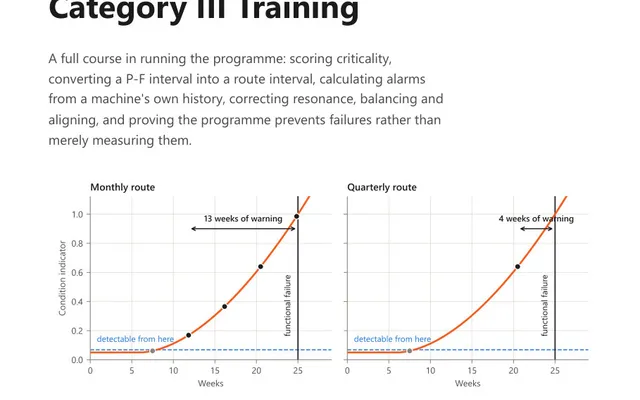
A 56-page course book on running the programme: criticality scoring, the P-F interval, and alarms calculated from the machine's own history, not a table.
OEE is availability multiplied by performance multiplied by quality, and the three factors are worth far more than the single percentage they produce. Each of them is a share of something the line was scheduled to have, and each of them belongs to different people.
Start with the shift. Planned production time is the time the line was scheduled to run, so planned stops such as a scheduled changeover come out of it rather than being counted as downtime. Take the unplanned downtime off that and what remains is run time:
run time = planned production time − unplanned downtime
availability = run time / planned production time
This is the share of the scheduled time the line was actually turning. It catches every stop long enough for somebody to notice and log.
performance = (ideal cycle time × total count) / run time
Read the numerator as the time the output was worth. Ideal cycle time is the fastest the machine can make one piece, taken from its nameplate rather than from a good day, so multiplying it by everything the line made gives the time those pieces should have taken. Dividing by the time the line actually spent running gives the fraction of run time that went into product.
The units are the trap here. Ideal cycle time is usually quoted in seconds and run time in minutes, so one of them has to be converted before the division. Get that wrong and the answer is sixty times too large or sixty times too small, which is at least obvious.
quality = good count / total count
Good count is the pieces that left saleable first time. Rework counts against quality, because the line spent two cycles on one saleable piece and the second cycle added nothing to the output.
OEE = availability × performance × quality
Sixty five percent tells nobody what to do. Sixty five percent made of 90, 74 and 98 is a speed problem. The same sixty five made of 74, 90 and 98 is a stoppage problem. One is a process engineering job and the other is a maintenance and changeover job, and they land on different desks. Read the three factors first and the product last, and use the product only for the trend.
Availability catches the stops long enough for somebody to log. Performance catches everything else: the minute lost to a jam that cleared itself, the line run below rate because one operator is covering two machines, the slow start after a break, the gradual drift down in speed that nobody notices because nothing stopped.
None of that appears in a downtime record, and on most lines it is the largest single loss. That is the practical reason to compute performance separately rather than to fold it into an overall number. It is the only one of the three that measures something nobody wrote down.
A line cannot beat its own ideal cycle time, so a performance above 100 percent means an input is wrong. There are two candidates. The cycle time may have been set from a good shift rather than from the machine capability, which is the common one and which quietly flatters every OEE the line has ever reported. Or the total count includes pieces the run did not make, which happens when a counter is reset late or carries over from the previous order.
Fix the cycle time from the machine data before anything else, and expect the historical numbers to fall when you do.
The widely quoted world-class target of 85 percent is 90 percent availability multiplied by 95 percent performance multiplied by 99.9 percent quality. Knowing where it comes from is more useful than the figure itself, because it shows that the quality term is nearly fixed and that almost all of the room is in the other two.
It is a reference point rather than a requirement. Across different processes it means very little: a line with frequent product changes carries changeover losses that a continuous process running one grade never sees, and no single percentage reconciles the two.
OEE earns its keep as a trend on one line, measured the same way every shift. As a number for comparing two plants it is close to useless, because the definitions of planned production time, of a stop worth logging and of the ideal cycle time all differ between them, and each of those differences moves the answer more than any real improvement will.
So fix the definitions once, write them down, and change them only deliberately. A step in the trend that came from a redefinition is worse than no trend at all, because somebody will spend a month explaining it.
A shift is scheduled for 480 minutes and loses 47 minutes to unplanned stops. The ideal cycle time is 1.0 second per piece. The line made 19271 pieces, of which 18848 were saleable first time.
Run time is 480 − 47 = 433 minutes.
Another way to see the performance term: 433 minutes at one second per piece leaves room for 25980 pieces, and the line made 19271 of them.
Now read the three. Availability is the healthiest of the three factors and quality is close behind it, with 423 pieces lost out of 19271. Performance is the loss worth working on, and the size of it is the point: 433 minutes of run time carried only 321.2 minutes of product, so 111.8 minutes went somewhere unrecorded. That is more than twice the 47 minutes of downtime that did get logged.
A shift report built on the downtime log alone would have shown 47 minutes lost and looked like a reasonable day. Splitting the number into three shows that the larger loss was never written down at all, which is the whole reason the calculation is done in three parts.
Multiply three factors. Availability is run time divided by planned production time, where run time is planned production time minus unplanned downtime. Performance is ideal cycle time times total count, divided by run time. Quality is good count divided by total count. OEE is the three multiplied together, so 90.2 percent availability, 74.2 percent performance and 97.8 percent quality give 65.4 percent.
That an input is wrong, because a line cannot beat its own ideal cycle time. Either the cycle time was taken from a good shift rather than from the machine capability, or the count includes pieces the run did not make. The first is the usual cause, and it quietly flatters every effectiveness figure the line has ever reported.
From multiplying 90 percent availability, 95 percent performance and 99.9 percent quality. It is a reference point rather than a requirement, and it means little across different processes: a line with frequent product changes and a continuous process running one grade are not comparable on a single percentage, whatever the benchmark says. Treat it as a way to read the three factors, not as a target.
Because the product does not say what to do. Sixty five percent made of 90, 74 and 98 is a speed problem, and the same sixty five made of 74, 90 and 98 is a stoppage problem, and the two belong to different people. Read availability, performance and quality first, and the product last.
Not usefully. The definitions of planned production time, of a stop worth logging and of the ideal cycle time differ between sites, and each of those differences moves the answer more than any real improvement will. OEE earns its keep as a trend on one line, measured the same way every shift, where a change in the number is a change in the line.
The calculator gives you the number. These course books explain what the number means and how the measurement that produced it should be taken.
A 56-page course book on running the programme: criticality scoring, the P-F interval, and alarms calculated from the machine's own history, not a table.
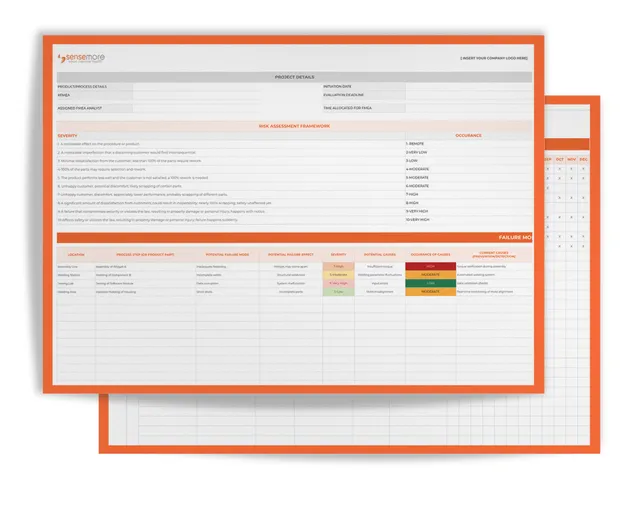
Optimize your maintenance strategy with our specialized Action Plan Spreadsheet. Download now to simplify maintenance tasks.