

Oil Analysis and Lubrication Training: Level 1
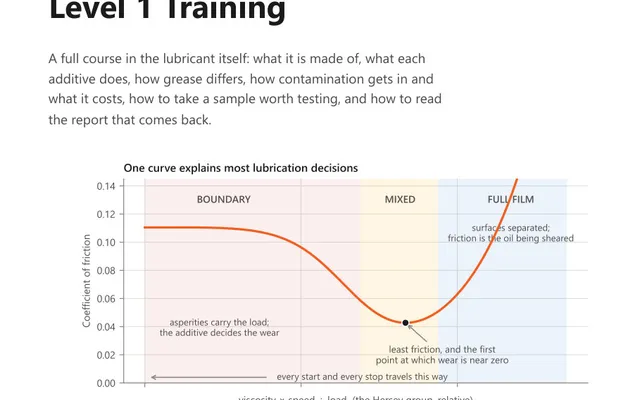
A 66-page course book on the lubricant itself, from the Stribeck curve to base oils, additives and grease, for the analyst who has to read a report.
Enter the two viscosities printed on any oil data sheet, at 40 and 100 degrees Celsius, and the calculator returns the kinematic viscosity at whatever temperature the oil actually runs at. The method is the Walther equation, which is the relationship the ASTM D341 chart draws as a straight line.
Viscosity against temperature is a steep curve on ordinary axes and useless to interpolate by eye. Plotted on the right scales it straightens out: the double logarithm of viscosity against the logarithm of absolute temperature. That is the Walther relationship, and it is what an ASTM D341 chart is made of.
Written in full:
log10(log10(v + 0.7)) = A − B × log10(T)
where v is kinematic viscosity in centistokes, T is absolute temperature in kelvin, and A and B are constants belonging to that particular oil. The 0.7 is a fixed offset added inside the logarithm so the expression still behaves at low viscosity.
Because it is a straight line in those coordinates, two points fix it. Every product data sheet publishes exactly two, at 40 and 100 degrees Celsius, which is why the calculation needs nothing but the data sheet.
With W40 and W100 standing for the double logarithm of each data sheet viscosity, and the two temperatures converted to kelvin as 313.15 and 373.15:
Once A and B are known, the viscosity at any temperature comes back by undoing the logarithms:
v = 10^(10^(A − B × log10(T))) − 0.7
B is the slope, and it is a direct measure of how sharply that oil thins. A steeper line means a bigger drop for the same rise in temperature.
An ISO VG 68 gear oil, 68 cSt at 40 degrees and 8.6 cSt at 100 degrees, running in a gearbox whose oil reaches 75 degrees at the mesh.
Taking the double logarithms and solving gives B = 3.652 and A = 9.378. Feeding 75 degrees, which is 348.15 kelvin, back through the equation:
| Temperature | Viscosity |
|---|---|
| 20 °C | 217 cSt |
| 40 °C | 68.0 cSt |
| 60 °C | 28.5 cSt |
| 75 °C | 17.0 cSt |
| 80 °C | 14.6 cSt |
| 100 °C | 8.60 cSt |
At the mesh the oil is at 17 cSt, a quarter of the number the grade is named after. Whether that is enough depends on what the gear needs, but the selection has to be argued at 17, not at 68.
Notice what the table does between 20 and 40 degrees. The same 20 degree step that costs 6 cSt between 80 and 100 costs about 149 cSt between 20 and 40. Cold starts and hot running are different problems, and one curve describes both.
ISO 3448 grades an industrial oil by its kinematic viscosity at 40 degrees Celsius, and each grade covers a midpoint plus or minus 10 percent. The grades are VG 2, 3, 5, 7, 10, 15, 22, 32, 46, 68, 100, 150, 220, 320, 460, 680, 1000 and 1500.
From VG 10 upwards the grade number is its own midpoint, so a VG 68 is centred on 68 cSt. The four grades below that are not named after their midpoints: VG 2 is centred on 2.2 cSt, VG 3 on 3.2, VG 5 on 4.6 and VG 7 on 6.8. Reading those four as though the name were the midpoint puts a perfectly legitimate VG 5, measured at 4.3 cSt, outside every grade on the ladder.
So an oil sold as ISO VG 68 measures between 61.2 and 74.8 cSt at 40 degrees, an ISO VG 320 measures between 288 and 352, and an ISO VG 5 measures between 4.14 and 5.06. A measured 40 degree viscosity that lands between two of those bands is either a blend, a used oil that has moved, or a mislabelled drum, and all three are worth knowing about.
The grade is a 40 degree label and nothing more. Two oils of the same grade can differ substantially at operating temperature, which is the whole reason for putting the second data sheet point to work.
The number to feed the equation is the temperature of the oil in the contact, not the reading on the sump gauge and not the temperature of the room. Oil in a loaded bearing or a gear mesh runs hotter than the reservoir it came from, commonly by 10 to 20 degrees, because the contact is where the shear heating happens.
That difference is not a rounding error on this curve. Working from the sump temperature when the contact is 15 degrees hotter overstates the film the oil can build, and film thickness is what the selection was trying to buy.
The equation holds for mineral oils across the range they are normally used in, and it fails in three recognisable places.
Near the pour point, wax begins to come out of solution and the real curve bends away from the line, so the calculation reports the oil as more fluid than it is. A multigrade containing a viscosity index improver is not described by the equation at all, because a polymer-thickened oil is not one fluid behaving one way. And below roughly 2 cSt the fixed offset inside the logarithm stops being a good approximation, so results down at that end deserve suspicion rather than a decimal place.
With the Walther equation, which is the relationship the ASTM D341 chart plots. Written out it is log10(log10(v + 0.7)) = A minus B times log10(T), where v is kinematic viscosity in centistokes and T is absolute temperature in kelvin. The two viscosities every data sheet gives, at 40 and 100 degrees Celsius, are enough to solve for the constants A and B, after which the viscosity at any temperature in between or a little beyond follows directly.
Because the oil film in a loaded bearing or a gear mesh is formed at the temperature of the contact, not at the temperature on the data sheet. Oil in a loaded contact runs hotter than the sump it came from, often by 10 to 20 degrees, and viscosity falls steeply with temperature. An oil selected on its 40 degree figure and run much hotter can be at a small fraction of the viscosity the selection assumed, and film thickness falls with it.
It is the kinematic viscosity of the oil in centistokes at 40 degrees Celsius, and the grade covers a midpoint plus or minus 10 percent. From VG 10 upwards the grade number is its own midpoint, so an ISO VG 68 oil measures somewhere between 61.2 and 74.8 centistokes at 40 degrees. The four grades below VG 10 are the exception: VG 2 is centred on 2.2, VG 3 on 3.2, VG 5 on 4.6 and VG 7 on 6.8. The grades are spaced so each is roughly half as thick again as the one below it: 32, 46, 68, 100, 150, 220 and so on. The grade says nothing about how the oil behaves at any other temperature.
Near the pour point and on oils that are not a single fluid. As wax starts to come out of solution at low temperature, the plotted line curves away and the equation overstates how fluid the oil still is. A multigrade containing a viscosity index improver is not described by it at all, because the polymer changes what the fluid does as temperature changes. Below roughly 2 centistokes the constant added inside the logarithm is also no longer a good approximation.
Yes, provided the oil is still behaving as one fluid. Two known points fix the Walther line, so a measurement at operating temperature plus one other point puts the whole curve back, including the 40 degree figure a specification is written against. The result is only as good as the assumption that the oil has not been diluted by fuel or thickened by oxidation, either of which moves the line rather than sliding along it.
The calculator gives you the number. These course books explain what the number means and how the measurement that produced it should be taken.
A 66-page course book on the lubricant itself, from the Stribeck curve to base oils, additives and grease, for the analyst who has to read a report.

A 59-page course book on what each oil analysis test measures and where it fails, with the chapter on wear particle morphology that most books skip.

37 practice questions on the oil analysis test methods, from viscosity and particle counting to wear particle morphology, each answer worked in full.