November 7, 2023
With significant enhancements made in our Signal Toolbox, one of our most critical tools for data analysis, we’ve elevated the user experience, making data analysis more user-friendly and efficient.
Signal Toolbox
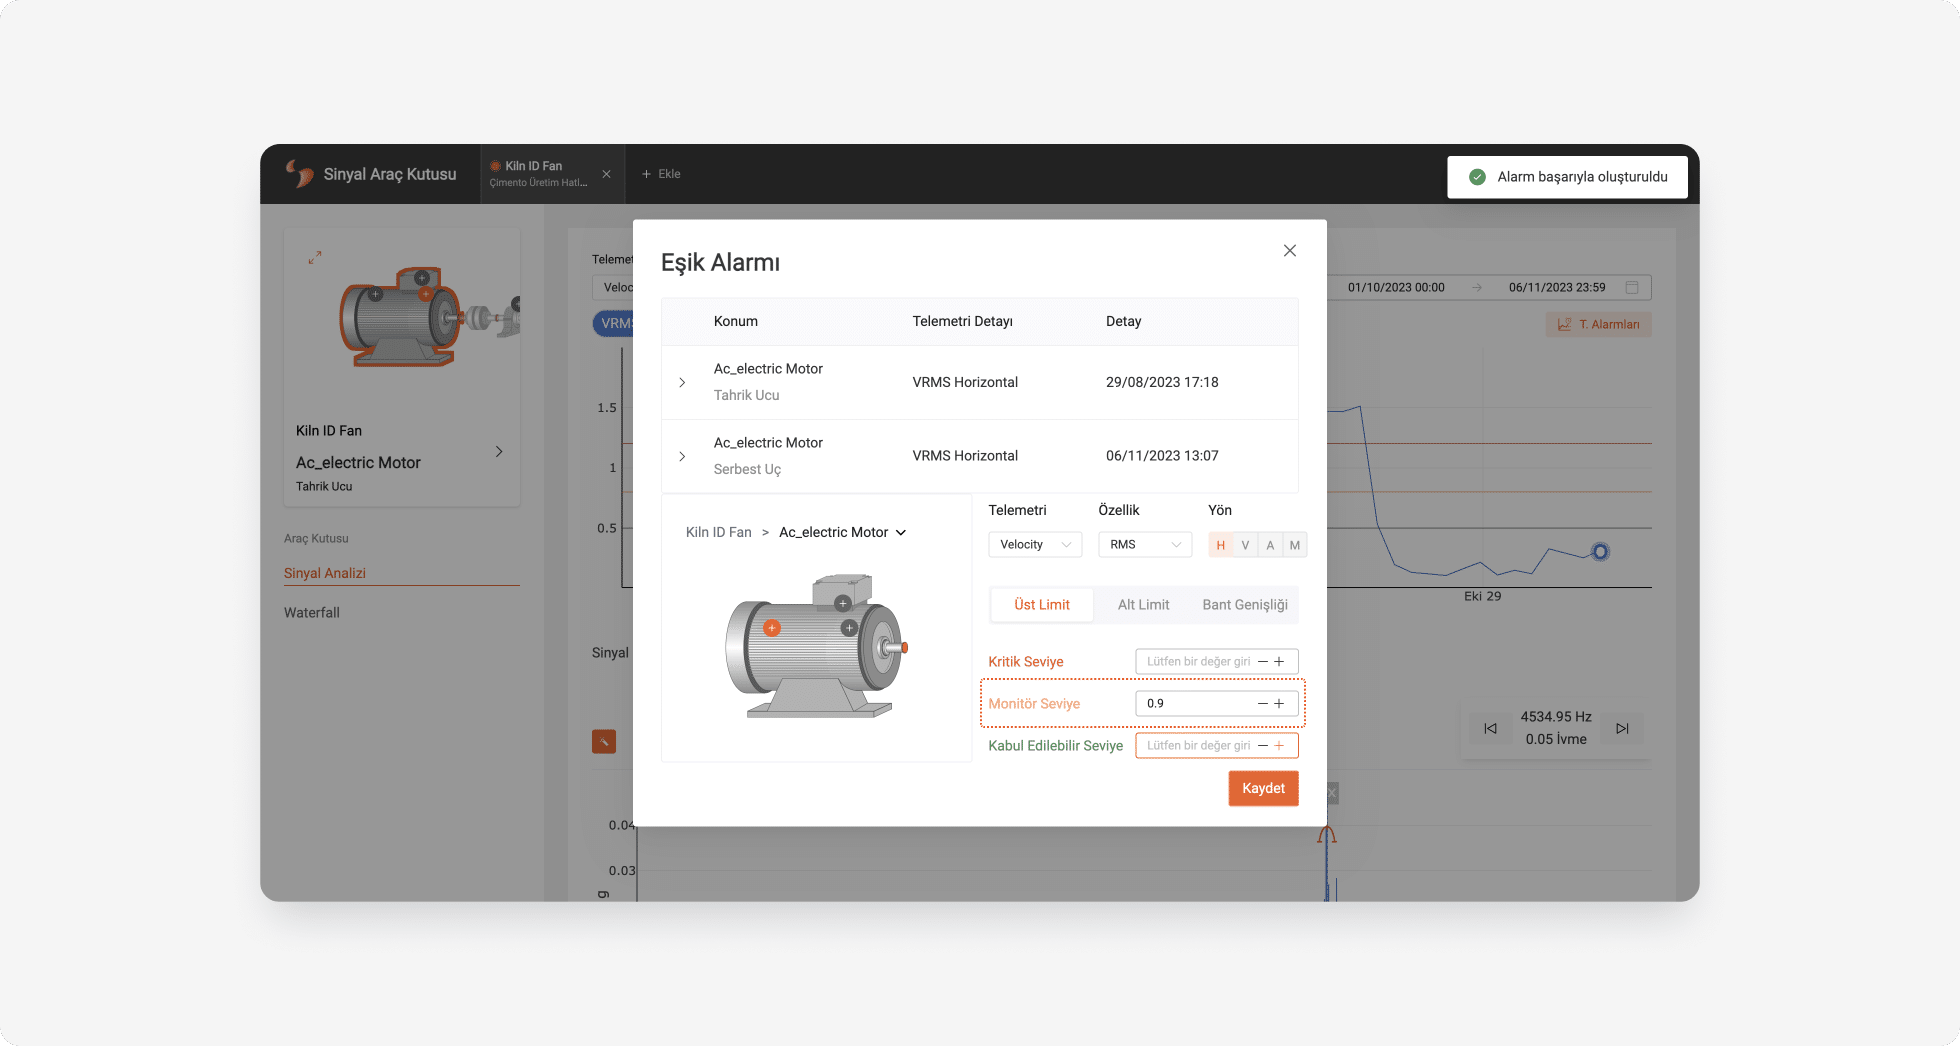
Enhanced Threshold Alarms for User-Centric Alerting
In the previous version, users were required to enter a value for all critical thresholds in threshold value alarms. With the latest improvement, users can now set alarms only for the desired thresholds based on their preferences and needs, allowing for a more flexible and user-centered approach.
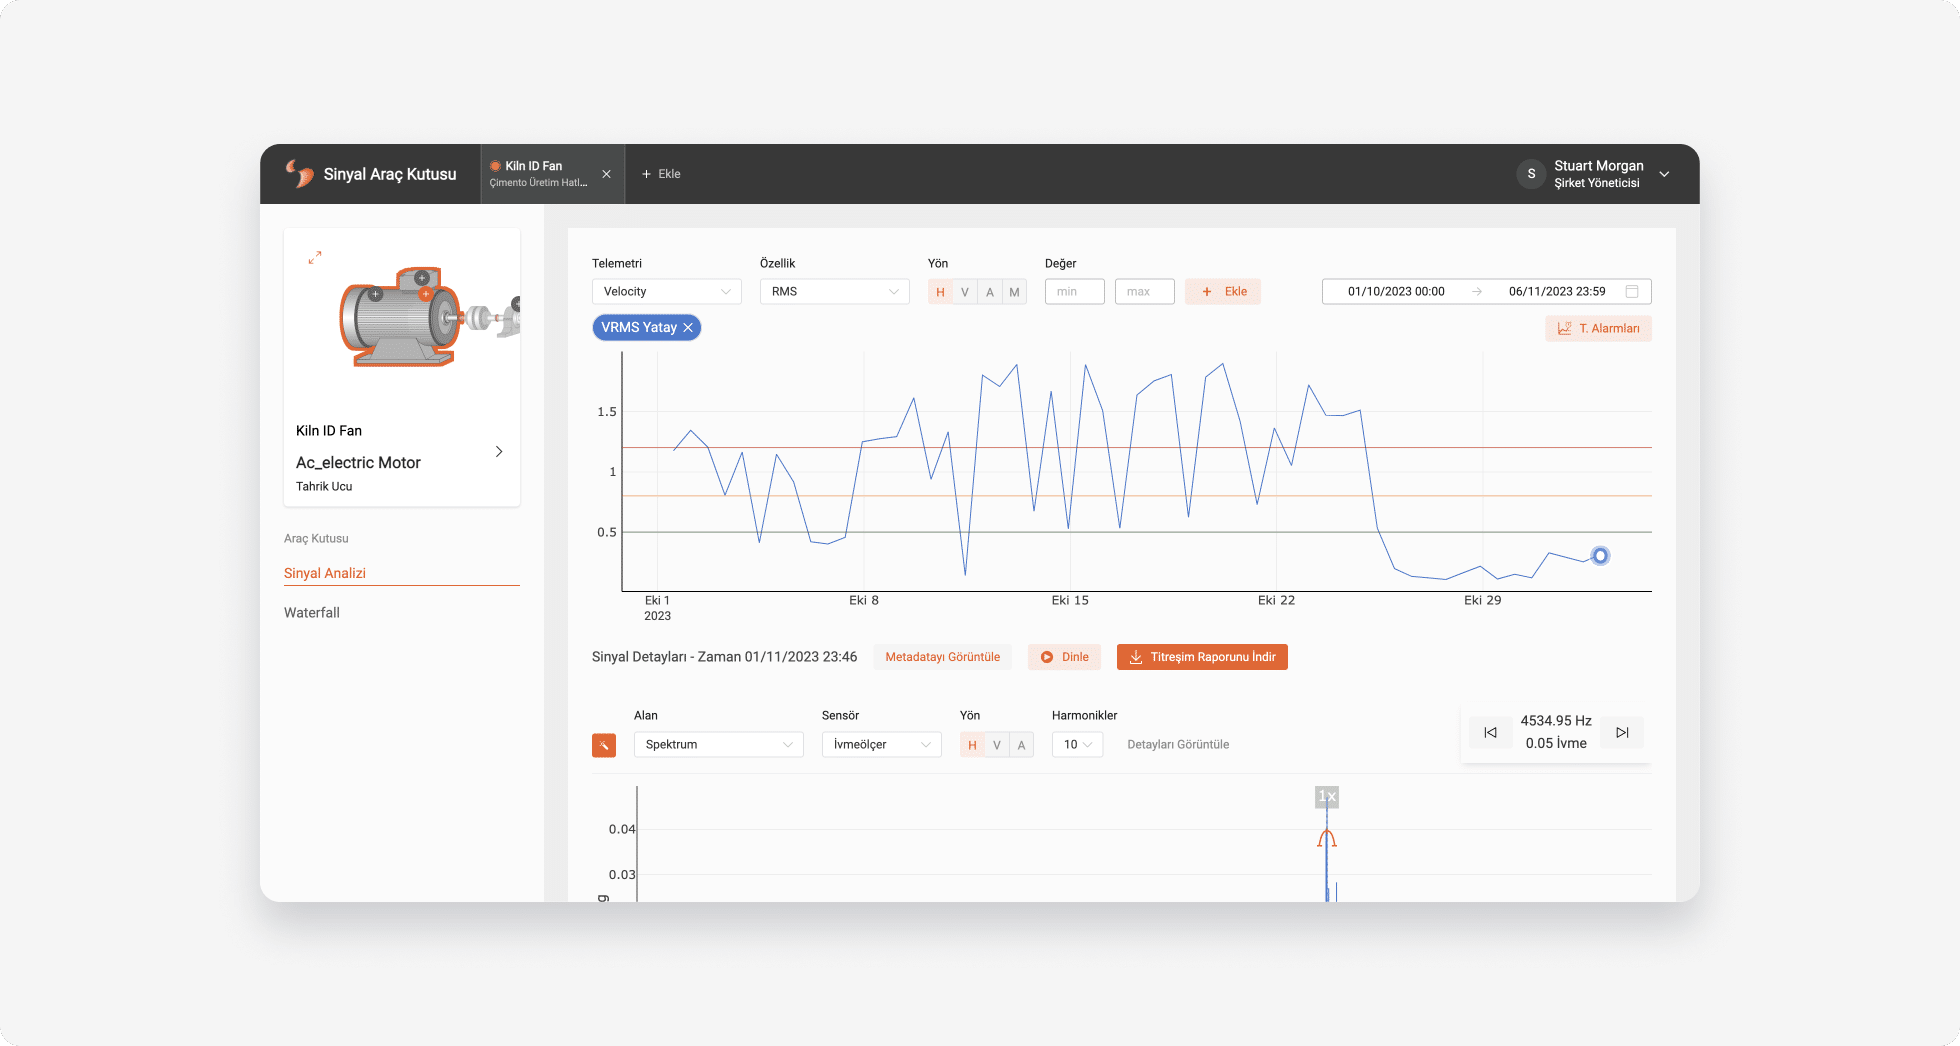
Improved Trend Graph Clarity and Readability
With the latest update to LAKE, the height of the trend graph has been significantly increased. This change provides users with more space, making it easier to read the graph and present data in a clearer and more comprehensible manner. Users can now comfortably examine more details and analyze data more effectively.
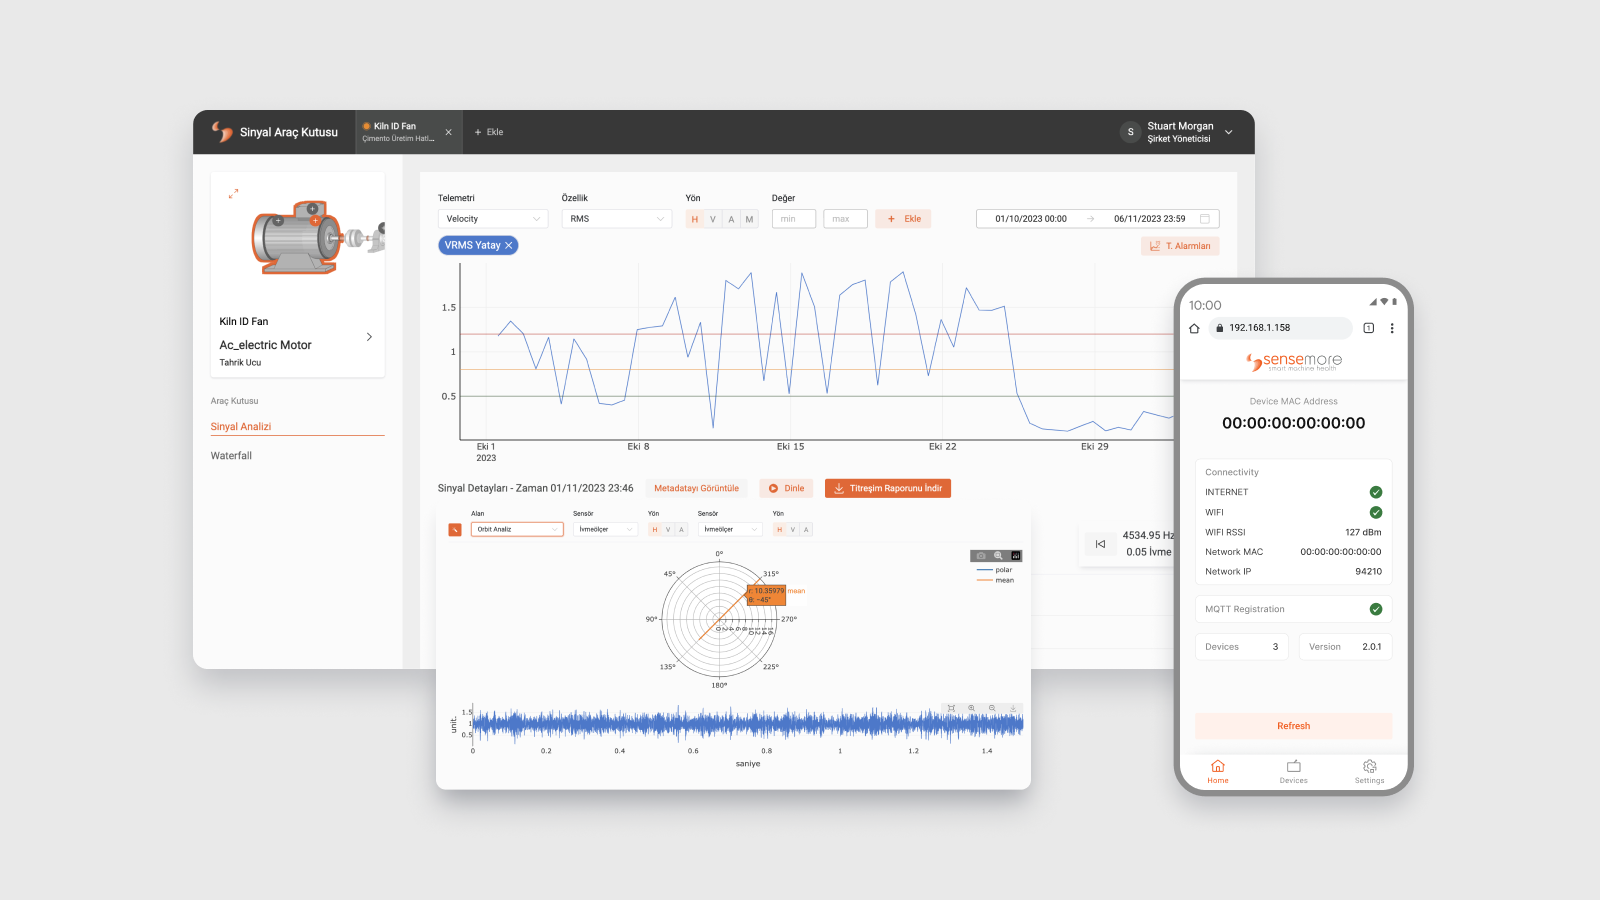
New Orbit Analysis Method for Enhanced Signal Analysis
In this update, we have added a new analysis method into the Signal Toolbox, called Orbit Analysis. It is a technique based on examining vibration data, and the shape and changes in the data provide valuable insights into the equipment’s condition. These analysis results are used to identify maintenance needs and optimize equipment performance.
With Orbit Analysis, signal analysis becomes more powerful and flexible, offering users more choices for data analysis, ultimately improving their decision-making process.

Peak Point Representation for Graphical Data Comparison
This is a feature that utilizes peak point representation in graphical data. This feature is designed to determine whether the clicked point on the graph represents a peak value or not by comparing it with the values to the right and left of the clicked point.
This enhancement offers users an efficient way to identify peak values within the data, facilitating a better understanding of critical data points and aiding in data analysis.
Reference Line for RPM on Signal Graph
We have introduced an improvement on a graphical display of manually entered RPM. By inputting this RPM value, the corresponding point on the signal graph is marked as the reference point. This enhancement facilitates easier and more detailed analysis, providing users with a valuable tool for in-depth data examination.
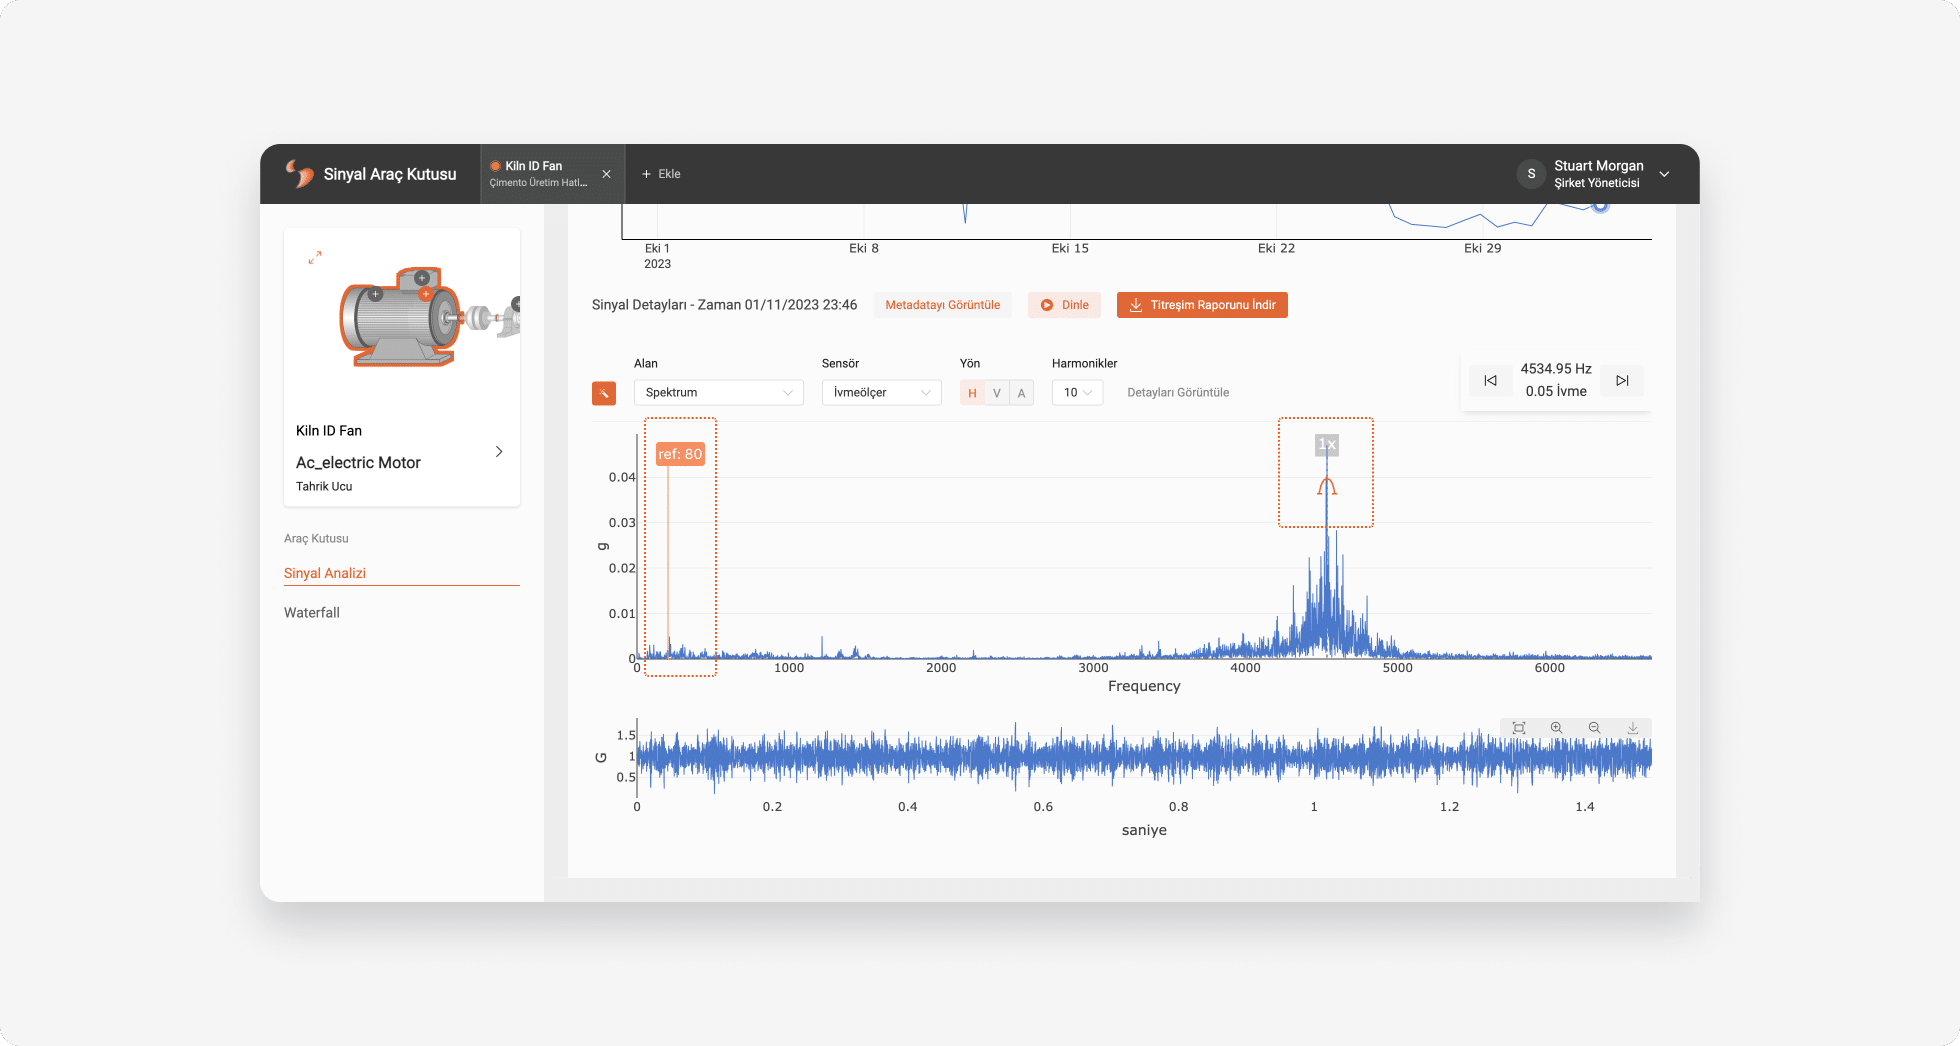
Vibration Report Export in Signal Toolbox
We have introduced the capability to export trend graph and detailed signal graphs in PDF format in the Signal Toolbox. This new feature empowers users to conveniently save data and analysis as PDF documents, and makes it easy to share with relevant team members.

Configuration
Redesigned Gateway Configuration Screens for Enhanced Mobile Usability
The current gateway configuration screens have been redesigned, with a particular focus on enhancing usability when accessed via mobile devices in the field. Not only have we streamlined all gateway configuration update processes, but we have also simplified user scenarios by enabling the definition of devices connected to the main device. This enhancement ensures a more user-friendly experience while configuring gateways and associated devices.

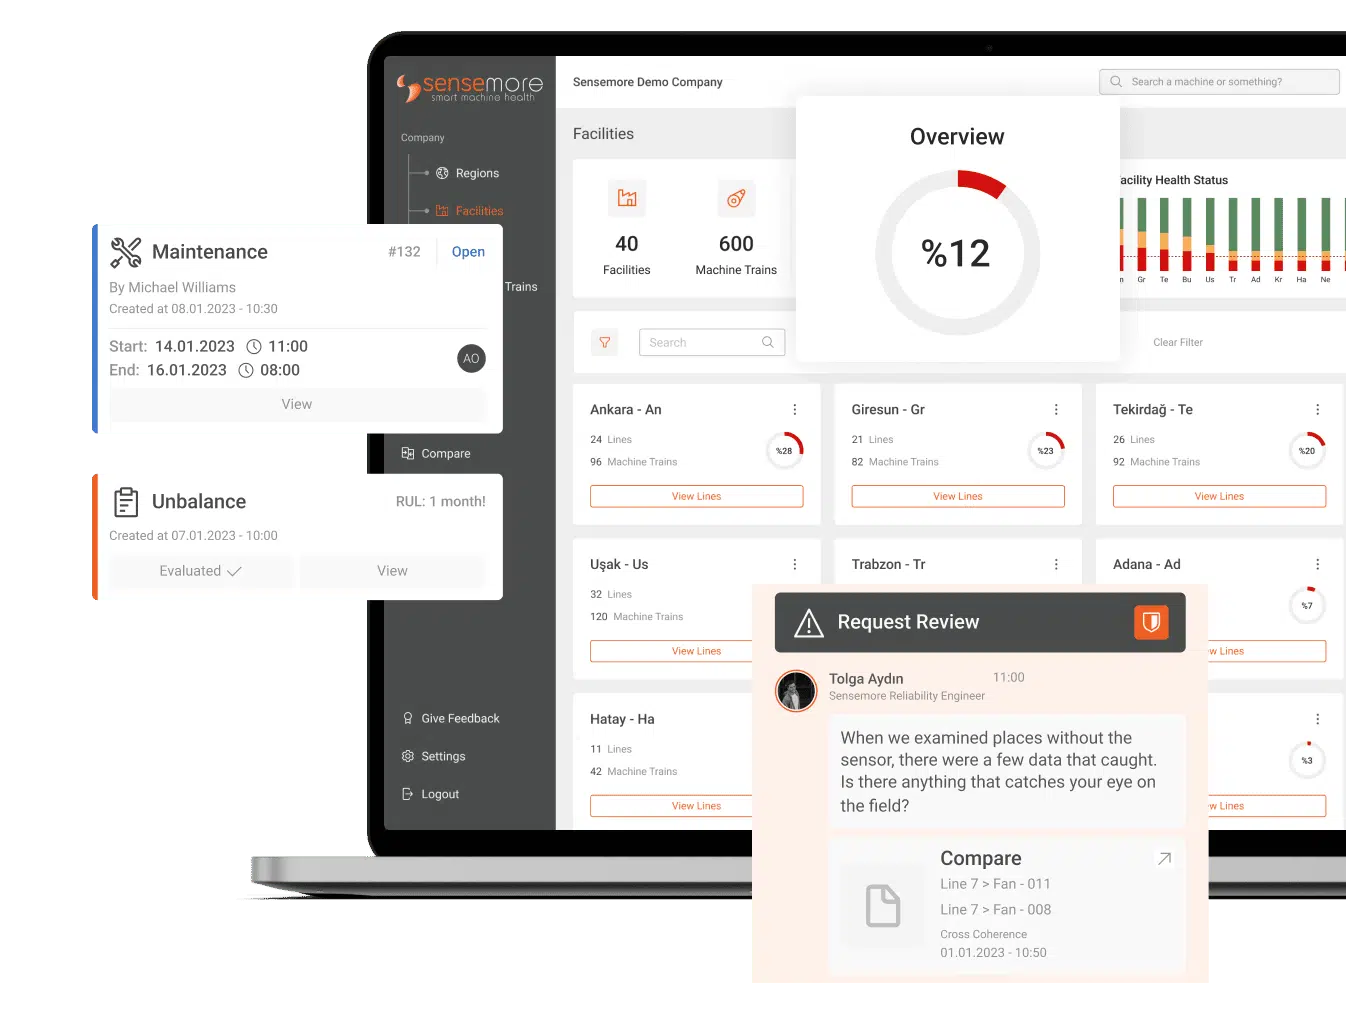
Discover Our Platform: LAKE
Sensemore LAKE is the reliability-focused data-driven machine health platform that offers users to create a digital maintenance culture to increase overall efficiency.