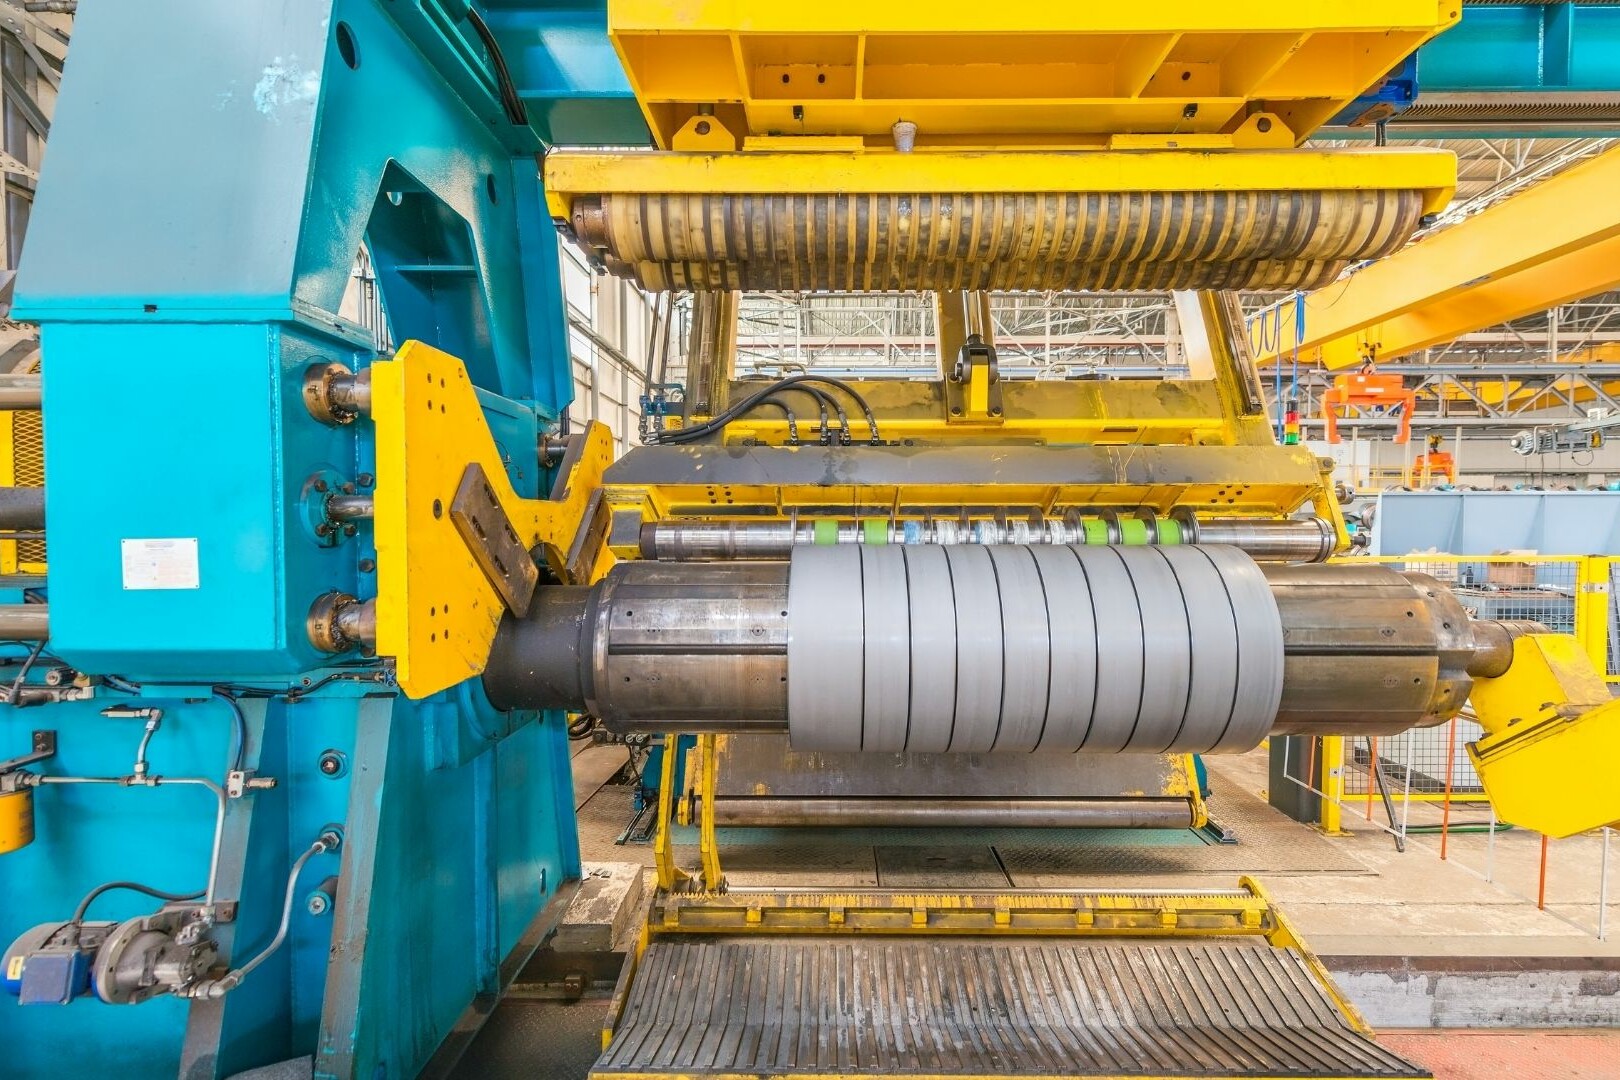
Although the great differences in the nature of maintenance operations in industrial facilities, it contains the processes where similar quantities such as; vibration, temperature, oil quality, etc. are measured for fault detection. During these processes, data from sensors are converted into different units with transducers and comments are made about system health.
RMS (Root Mean Square) is generally used in vibration analysis. It is widely used because the RMS vibration profile gives information about the energy content and thus the destructive capacity of the vibration. However, it is not correct to deduce about the system with a single parameter. Therefore, various parameters are used in troubleshooting, and a multi-parameter approach gives the best results to help identify the root cause of the problem. Sensemore provides outputs by adopting this procedure with various parameters in its interface for accurate fault detection in vibration analysis, while also allowing the user to add different telemetry.
The biggest advantage of vibration analysis is that it can detect developing problems of machinery and equipment before they become too serious and cause downtime. This can be achieved by monitoring machine vibrations regularly or in certain intervals. Fault detection can be performed in various ways. We can examine the methods used in predictive maintenance under 2 main headings:
1. Time Waveform Analysis
2. Frequency Domain Analysis
Time Waveform Analysis for Fault Detection
Time waveform analysis involves capturing the vibration signal from an accelerometer, converting it into a digital signal, and visualizing it. This signal exists in the time domain, where amplitude is plotted against time. While most machines primarily use spectrum analysis for detecting vibration issues, certain types of waveforms can effectively complement spectral data. Time waveforms are particularly useful in low-speed applications, assessing bearing failures, displaying true amplitudes, and enhancing spectral data in situations involving looseness or beats.
Roller bearings with rolling elements exhibit periodic effects when they encounter minor cracks or wear. In the presence of external noise, the signal’s spectrum may not clearly reveal distinct peaks. However, when acceleration occurs, these peaks typically appear with repetition rates matching the defective frequency of the bearing race or the bearing ball pass frequency period.

Fig. 1 Typical Faults a)Imbalance b)Outer Ring Damage c)Beat Phenomenon d)Looseness
When two or more neighboring machines run at nearly the same speed, they can generate a phenomenon known as “beating.” This results in sum and difference frequencies in the current. Beat frequencies, although usually of very low frequency and hard to spot in the spectrum, become evident when you examine the time record as an amplitude-modulated signal.
In cases of looseness, such as a slight rise in a bearing block during part of its rotation causing vibrations, followed by it settling back to the base for the rest of the cycle, the waveform flattens beyond a certain point. In the spectrum, these manifest as harmonics that can be mistaken for other types of waveform distortions. Looseness that restricts movement in one direction is quickly identifiable.
When a loose machine component collides with equipment at a speed unrelated to the machine’s speed, it generates random and often non-periodic vibrations. While this spectrum may resemble other sources of broadband noise, these effects are clearly visible in the time-domain waveform.
From the time record of a vibration signal, various indices can be extracted to aid in diagnosis. Frequently used indices are statistical parameters that can be calculated from the raw signal. These parameters highlight variations between records, making them valuable for diagnostics and trend analysis. They don’t pinpoint the exact faulty component but guide us to take action against potential faults. Some of these parameters include RMS, crest factor, skewness, kurtosis factor, and clearance factor. Regularly tracking these features is a common technique for monitoring. If these values differ significantly from the reference or baseline values (measured under normal conditions), it’s a sign that something is amiss in the system.
RMS (Root Mean Square)
The RMS (Root Mean Square) value is a measure of the energy content in a vibration signal. It is one of the most accurate statistical parameters for assessing the severity of machine failures. While it’s excellent for monitoring overall vibration levels, it doesn’t pinpoint the specific faulty component. However, the RMS value is highly effective in detecting significant imbalances in rotating equipment systems and tends to increase with the occurrence of shock pulses.
The RMS value is calculated by considering the time history of the vibration wave. It provides valuable insights into the vibration’s energy content, but it won’t identify which part of the machine is causing the issue. The following equations are used to calculate RMS values for both discrete and continuous time signals.
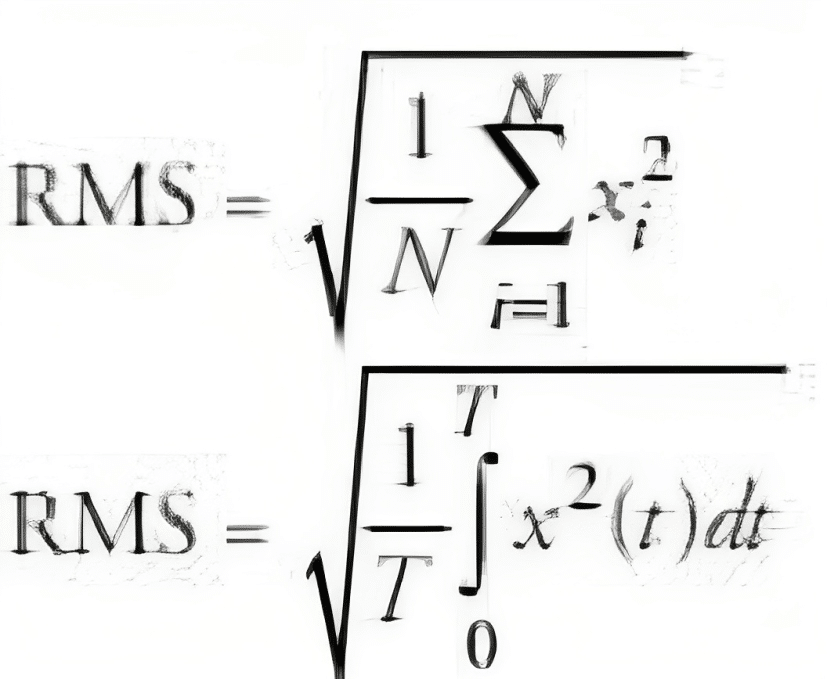
Fig. 2 RMS Formula
Crest Factor
Crest Factor is a crucial parameter defined as the ratio of a waveform’s peak value to its RMS value. It’s a dimensionless measure. In Figure 3, the expression provides the specific definition of the crest factor. For a sine wave, the crest factor is 1.414. When receiving a typical vibration signal from a machine with a significant imbalance but no other issues, the crest factor reaches 1.5. However, as bearings wear and lead to impacts, the crest factor can increase significantly.
The underlying principle is that when bearings deteriorate, the peak levels of acceleration rise faster than the RMS levels due to increased impulsiveness. Calculating the crest factor is straightforward, and it isn’t greatly affected by bearing speed and load. During the early stages of bearing damage, the inner race, bearing housing, rolling elements, and cage can generate periodic impact signals, causing the crest factor to rise. As the damage worsens, the RMS value increases, leading to a decrease in the crest factor value.

Fig. 3 Crest Formula
Skewness
Skewness is a parameter that assesses the asymmetrical behavior of a vibration signal by analyzing its probability density function. It measures how unsymmetrical the signal is around its mean value. If a signal is perfectly symmetrical, its skewness value is zero. In the context of most vibration signals, the probability distribution is typically symmetrical, resembling a normal distribution. Therefore, a non-zero skewness value often signals that something might be amiss.
Skewness serves as a dimensionless measure to indicate the absence of symmetry in the distribution of the signal. It’s a valuable tool for identifying deviations from the expected patterns in vibration data.

Fig. 4 Skewness Formula
Kurtosis Factor
The kurtosis factor is a statistical measure that helps us understand the pulse-like characteristics of a signal. A high kurtosis factor suggests the presence of repetitive impulses within the signal. It aids in determining whether the spectrum displays small peaks spread across a wide frequency range or a few distinct peaks at specific frequencies. Kurtosis is especially useful when monitoring low-speed rotating shaft bearings, where traditional frequency-based techniques may have limitations.
A normal bearing typically has a kurtosis factor of 3. Signals with higher kurtosis values exhibit more pronounced peaks, often exceeding three times the RMS value of the signal. This can indicate the presence of significant impulses or shocks within the data.
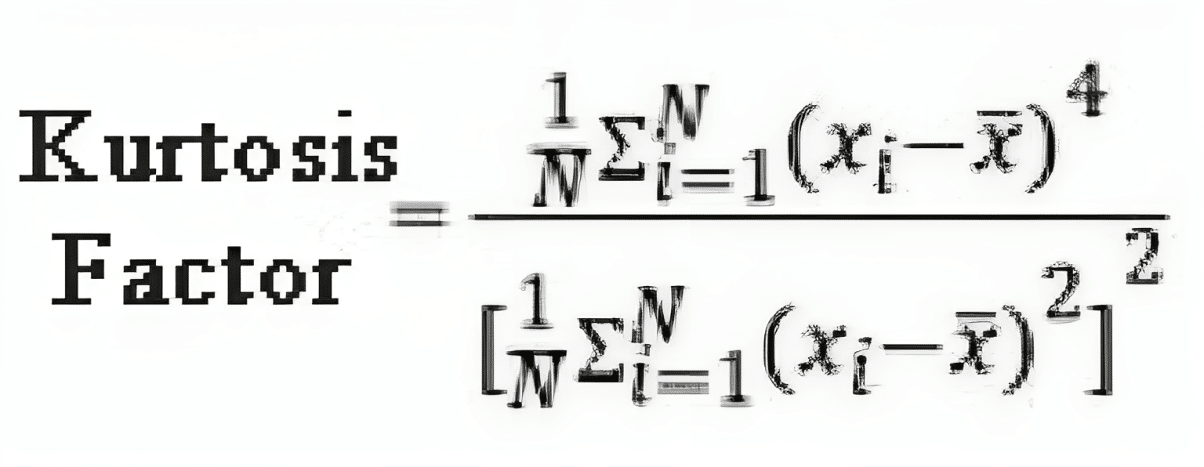
Fig. 5 Kurtosis Factor
Frequency Domain Analysis
To better understand vibration data, mathematical transformations are employed to derive processed signals that unveil insights not immediately evident in the raw data. One of the most common transformations is converting the time-domain data into the frequency domain. This conversion is achieved by applying the Fourier Transform to the vibration signal.
Through this process, the energy present in the original signal is distributed across various frequency components, resulting in a representation of amplitude versus frequency. This method is advantageous because it clearly presents any periodic patterns in the vibration signal as peaks in the spectrum, each corresponding to a specific frequency. This feature allows for the early fault detection of faults that often generate distinct frequency components in the vibration signal. It also facilitates tracking changes over time as the situation worsens.
However, it’s important to note that frequency domain analysis has a drawback: during the conversion process, it may lose some information, particularly transitions and non-repetitive signal components. Despite this limitation, it remains the most widely used technique in machine diagnosis. Remarkably, it can detect approximately 85% of mechanical problems in rotating equipment, making it a valuable tool in maintenance and fault detection.
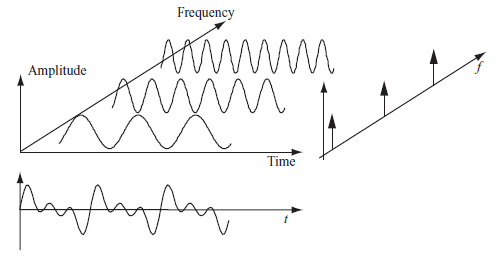
Fig. 6 Signal View from Time and Frequency Domains
Each component within a machine exhibits characteristic frequencies in response to the applied force. These frequencies are instrumental in diagnosing machine failures. Different types of faults produce distinct spectra. Once the time-based signals are transformed into the frequency domain, they can be compared to characteristic fault spectra. This comparison allows us to determine which equipment is affected and understand the underlying cause of the fault.
The specific characteristics of a failure depend on factors like the rotation speed of the moving parts, the frequencies associated with inner and outer race transitions in bearings, gear networks, and more. These factors dictate the unique frequencies associated with different equipment. For instance, when examining a motor-pump system connected via a coupling and experiencing parallel misalignment, you’ll notice a radial peak at the motor’s rotation frequency in the spectrum. Peaks at the 2nd and 3rd multiples of the motor’s rotation frequency, with the 2nd harmonic predominantly visible, are also indicative of this issue.
This spectrum pattern can be observed early in the onset of a fault. To gauge the severity of the situation, we measure the amplitudes of the characteristic fault frequencies. This helps establish threshold values, enabling us to assess the severity of the issue based on various standards. Therefore, when analyzing the spectrum, we examine the frequency axis to pinpoint the cause of the failure, and the amplitude axis to determine the fault’s seriousness.
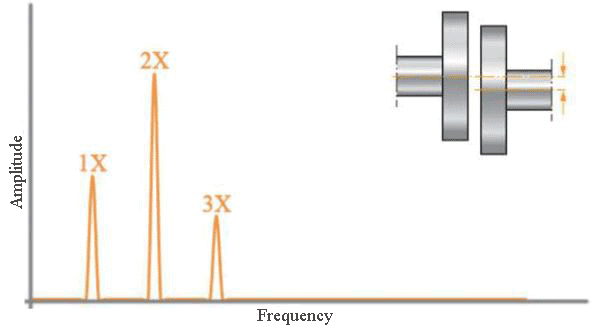
Fig. 7 Characteristic Parallel Misalignment Spectrum
Fault Detection with Sensemore
Sensemore offers a range of solutions for vibration analysis, covering both Time Waveform and Frequency Domain analysis. With Sensemore, you can conveniently visualize the raw accelerometer data in formats like GRMS and VRMS. It enables you to create alarms based on the trends of periodic equipment measurements, including total GRMS, VRMS, and temperature values over time. These alarms can be delivered to you via email or mobile notifications, keeping you informed about the state of your equipment. See article: First Step in AI-Based Predictive Maintenance
Sensemore makes it easy to monitor your data in the time domain by creating trends using various statistical parameters such as crest factor, kurtosis, and skewness. These trends help you analyze your data more effectively.
In spectrum analysis, you can effortlessly examine the harmonics of peak-forming frequencies and compare them with common fault spectra available in our library.
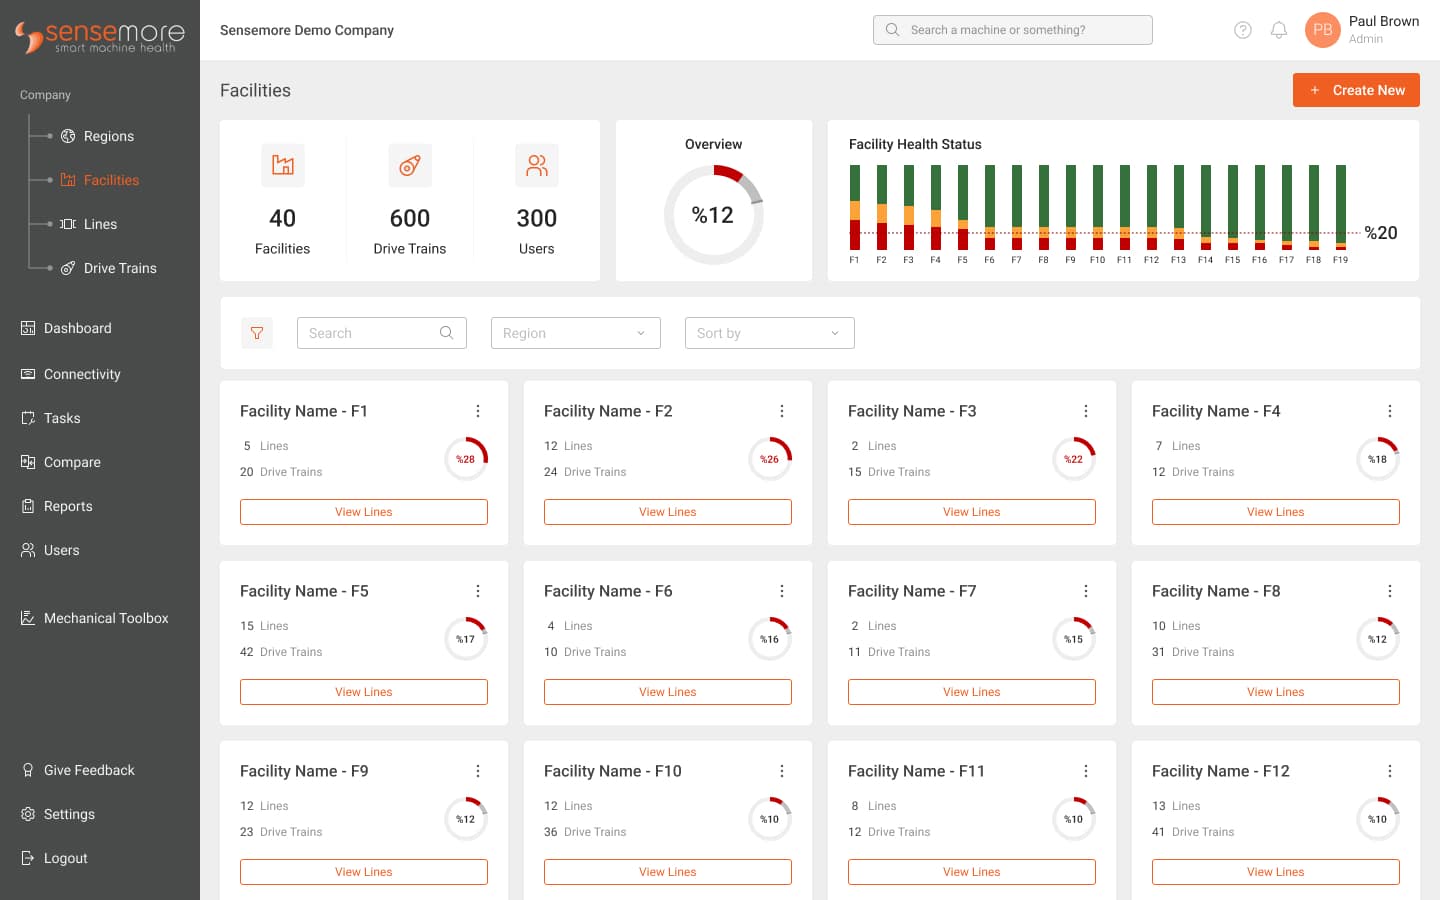
Fig. 8 Sensemore LAKE Facility Dashboard
References:
Recommended Blog Posts
September 4, 2023
Powerful Signal Analysis Tools for Vibration Analysis
Predictive maintenance, crucial for machinery reliability, heavily relies on vibration analysis. Techniques like FFT…
September 4, 2023
Rotating Machinery Vibration Analysis
Vibration analysis is a critical tool in various industries like manufacturing, power generation, and transportation.…
December 28, 2022
Fault Diagnostic Technique Using Machine Mode Similarity Analysis
AI can diagnose machine faults with vibration data but machine mode similarity analysis is an alternative, it uses…
September 15, 2022
Understanding Rotating Machinery Data
Machine data is generated by physical attributes and actions of machines, collected by sensors and analyzed for…
August 6, 2021
Envelope Analysis
Bearings are critical elements in rotating machines, they support radial and axial loads, and reduce friction. Real…
May 6, 2021
What is Cepstral Analysis?
Cepstral Analysis, a tool used to detect periodicity in frequency spectrum, can be useful in gearbox fault detection in…
September 21, 2020
Parameter Selections in Vibration Measurement
Vibration measurements are used to determine the response of machines to forces and identify potential issues. It is…
September 4, 2020
What is Vibration Analysis?
Vibration analysis can be used to discover problems in machines and predict when they might fail. It can significantly…


