Cepstral analysis, rooted in speech processing and telecommunications, emerged in the mid-20th century to address challenges in analyzing complex signals, particularly human speech. Initially applied for speech recognition, it evolved to find diverse applications in audio signal processing, biomedical signal analysis, and industrial machinery diagnostics. This versatility stems from its ability to reveal hidden patterns within signals by transforming them into the cepstral domain.
Fundamental Concepts of Cepstral Analysis
Fourier Transform and Power Spectrum:
- Fourier Transform decomposes a signal into its frequencies.
- Power spectrum, derived from the Fourier Transform, highlights signal power distribution across frequencies.
Logarithm of the Power Spectrum:
- Taking the logarithm compresses the spectrum’s dynamic range, aiding analysis by enhancing visibility of lower-intensity components.
Inverse Fourier Transform and Cepstrum:
- Applying the inverse Fourier Transform to the logarithmized power spectrum yields the cepstrum.
- Cepstrum captures variations in spectral components, crucial for tasks like fault detection in industrial machinery.
Understanding these concepts is essential for grasping cepstral analysis principles, facilitating advanced applications across scientific and industrial domains.
Cepstral Analysis Techniques
Homomorphic Cepstral Analysis (HCA)
Improved Feature Extraction with Homomorphic Filtering:
HCA extends traditional cepstral analysis by incorporating homomorphic filtering. This technique separates high and low-frequency components, enhancing the analysis of complex signals. HCA is particularly effective for non-linear signals with varying spectral shapes, making it valuable for diverse and dynamic machinery diagnostics.
Machinery Diagnostics Applications:
HCA excels in industrial machinery diagnostics, leveraging homomorphic filtering for fault detection, condition monitoring, and predictive maintenance. Its effectiveness in handling non-stationary signals makes it crucial for identifying fault signatures that traditional methods may miss.
Quefrency Analysis
Exploration of Hidden Patterns in Quefrency Domain:
Quefrency analysis examines cepstral coefficients in the quefrency domain, offering insights into hidden temporal patterns. This approach is advantageous for revealing modulation patterns and periodicities in the signal structure.
Significance in Non-Stationary Signal Analysis:
Quefrency analysis is vital for analyzing non-stationary signals, capturing temporal variations in equipment conditions. In machinery diagnostics, where dynamic changes are common, quefrency analysis becomes a valuable tool for detecting anomalies not easily apparent in the frequency domain alone.
The exploration of Homomorphic Cepstral Analysis and Quefrency Analysis demonstrates advanced cepstral techniques that address specific challenges in signal processing. These approaches enhance cepstral analysis’s adaptability to the complex and dynamic nature of signals encountered in industrial machinery diagnostics.
Signal Preprocessing for Industrial Machinery
Data Acquisition
Sensor Types and Strategies:
Data acquisition is vital for industrial machinery diagnostics. Sensors like accelerometers, microphones, and current sensors capture specific machinery aspects. Selection depends on machinery characteristics and analysis needs. Strategies involve determining sampling frequency, duration, and synchronization methods for a comprehensive operational representation.
Challenges in Data Acquisition:
Data acquisition in industrial settings faces challenges like harsh environments and external interferences. Ensuring reliable data is crucial. Challenges include sensor calibration, signal distortion, and the need for specialized sensors in extreme conditions.
Noise Reduction Techniques
Filtering for Signal Enhancement:
Noise reduction is critical for accurate analyses. Filtering methods like low-pass, high-pass, or band-pass filters isolate relevant frequency components while attenuating unwanted noise. Adaptive filtering adjusts parameters based on signal characteristics to emphasize informative components related to machinery condition.
Balancing Noise Reduction and Information Preservation:
There’s a trade-off between noise reduction and preserving valuable information. Aggressive filtering may lead to the loss of subtle features crucial for fault detection. Balancing this trade-off involves considering signal characteristics and diagnostic goals. Advanced methods, such as wavelet denoising or time-frequency analysis, effectively reduce noise without compromising signal integrity.
Signal preprocessing establishes a foundation for accurate analyses in industrial machinery diagnostics. The careful selection of sensors, robust data acquisition, and judicious noise reduction ensure high-quality data for subsequent cepstral analysis, enhancing diagnostic reliability.
Advanced Feature Extraction
Time-Frequency Representations
Spectrogram Analysis with Cepstral Techniques:
Time-Frequency Representations (TFRs), especially spectrogram analysis, complement cepstral techniques for improved feature extraction from non-stationary signals. Spectrogram analysis visually represents the evolution of signal frequency content over time. Combining this with cepstral techniques captures both spectral and temporal characteristics, beneficial in industrial machinery diagnostics with varying operating conditions and transient fault signatures.
Adaptive Methods for Operating Conditions:
Adaptive methods in time-frequency analysis are essential for handling changing machinery conditions. Dynamic adjustments to analysis parameters accommodate shifts in signal characteristics. Adaptive spectrogram analysis ensures effective feature extraction under different loads, speeds, or environmental conditions, enhancing the robustness of advanced feature extraction techniques for accurate diagnostic assessments.
Higher-Order Cepstral Coefficients
Beyond First-Order Exploration:
Exploring higher-order cepstral coefficients provides a more detailed signal representation. Second-order (quefrency cepstral coefficients) and beyond offer insights into finer spectral features. Considering longer quefrency lags captures subtle variations, enhancing the discriminative power of the analysis.
Implications for Nuanced Information:
Higher-order cepstral coefficients are crucial for capturing nuanced information within the signal. They provide a comprehensive representation of subtle changes in spectral patterns associated with machinery faults. This detailed information distinguishes between fault modes, identifies early signs of degradation, and enhances diagnostic sensitivity to subtle changes in machinery behavior.
The integration of time-frequency representations and exploration of higher-order cepstral coefficients represent advanced feature extraction techniques. These methodologies offer a more comprehensive set of features from industrial machinery signals, ensuring diagnostic analysis is equipped to handle diverse operating conditions and detect subtle deviations indicative of potential faults.
Applications in Industrial Machinery
Vibration Analysis
Fault Monitoring through Vibration Data:
Vibration analysis is vital in industrial machinery diagnostics, utilizing cepstral analysis to extract features and identify faults. Cepstral analysis effectively captures distinctive frequency patterns associated with faults like imbalance, misalignment, or bearing deterioration. Early fault detection contributes to predictive maintenance and minimizes downtime.
Cepstral Analysis in Bearing Faults:
Cepstral analysis is particularly effective in diagnosing bearing faults by isolating and highlighting specific frequency components associated with defects. It not only detects bearing faults but also characterizes their severity and progression over time in vibration signals.
Acoustic Emission Analysis
Defect Detection through Acoustic Signals:
Acoustic emission analysis monitors machinery sounds for defect detection. Cepstral analysis applied to acoustic signals extracts features indicative of machinery condition, discerning unique frequency patterns associated with various faults like friction, cavitation, or structural damage.
Efficacy Demonstrated in Case Studies:
Real-world case studies highlight cepstral analysis’s efficacy in acoustic emission applications, showcasing successful identification and characterization of defects. These studies underscore the practical value of cepstral analysis in timely maintenance interventions.
Motor Current Signature Analysis
Fault Detection through Motor Current Patterns:
Motor Current Signature Analysis (MCSA) monitors electric motor current waveforms for fault detection. Cepstral analysis is integrated to capture features revealing subtle changes associated with faults like winding faults, rotor imbalances, or broken rotor bars.
Integration into Motor Diagnostics:
Cepstral analysis integration enhances fault detection and classification accuracy in motor diagnostics. Analyzing cepstral features from motor current signatures provides insights into specific fault modes, facilitating condition monitoring, predictive maintenance, and motor performance optimization in industrial settings.
Comparative Analysis
Comparison with Other Diagnostic Techniques
Contrast with Time-Domain and Frequency-Domain Methods:
Cepstral analysis stands out from traditional time-domain and frequency-domain methods. In the time domain, methods like envelope analysis may struggle with nuanced frequency variations, while cepstral analysis, incorporating both temporal and spectral information, offers a comprehensive representation for non-stationary signals. Unlike frequency-domain methods, cepstral analysis excels in detecting anomalies across a broad frequency range.
Strengths and Weaknesses Relative to Alternative Approaches:
Cepstral analysis excels in handling non-linear and non-stationary signals, enhancing fault detection with sensitivity to subtle spectral changes. Challenges include sensitivity to noise, impacting diagnostic accuracy. Compared to alternatives like wavelet analysis or empirical mode decomposition, cepstral analysis uniquely balances capturing both temporal and spectral features, with the choice dependent on specific application requirements.
Machine Learning Integration
Integration of Cepstral Features into Machine Learning Models:
Cepstral features serve as valuable inputs for machine learning models, enhancing their ability to recognize and classify machinery conditions. Cepstral coefficients contribute to training algorithms, enabling automated decision-making based on historical data patterns and improving fault prediction accuracy.
Enhancing Predictive Maintenance through Combined Approaches:
The synergy of cepstral analysis and machine learning enhances predictive maintenance. Machine learning, trained on cepstral features, learns complex signal patterns, surpassing traditional cepstral analysis alone. This combination improves the overall effectiveness of predictive maintenance programs, fostering more reliable and efficient industrial machinery operations.
Challenges and Solutions
Robustness to Environmental Variations
Addressing Changes in Operating Conditions:
The robustness of cepstral analysis to environmental variations, such as temperature, load, or speed changes, is crucial for real-world applicability. Adaptive cepstral analysis techniques dynamically adjust parameters based on evolving operating conditions, ensuring effectiveness in dynamic industrial environments.
Adaptive Cepstral Analysis Techniques:
Adaptive cepstral analysis algorithms automatically adjust parameters, enhancing resilience to varying operating conditions. These techniques contribute to the reliability of fault detection and diagnostic outcomes by adapting to signal characteristics in real-time.
Real-Time Implementation
Considerations for Real-Time Implementation:
Real-time cepstral analysis is vital for timely fault detection and proactive maintenance. Considerations include selecting computationally efficient algorithms, optimizing parameters, and minimizing processing delays. Real-time implementation enables immediate responses to changing machinery conditions, preventing potential failures.
Computational Efficiency and Hardware Constraints:
Efficient cepstral analysis algorithms are crucial for resource-constrained environments. They reduce processing times and enable integration into embedded systems or edge devices. Considering hardware constraints, such as memory and processing power, ensures seamless deployment in industrial settings with a focus on real-time monitoring.
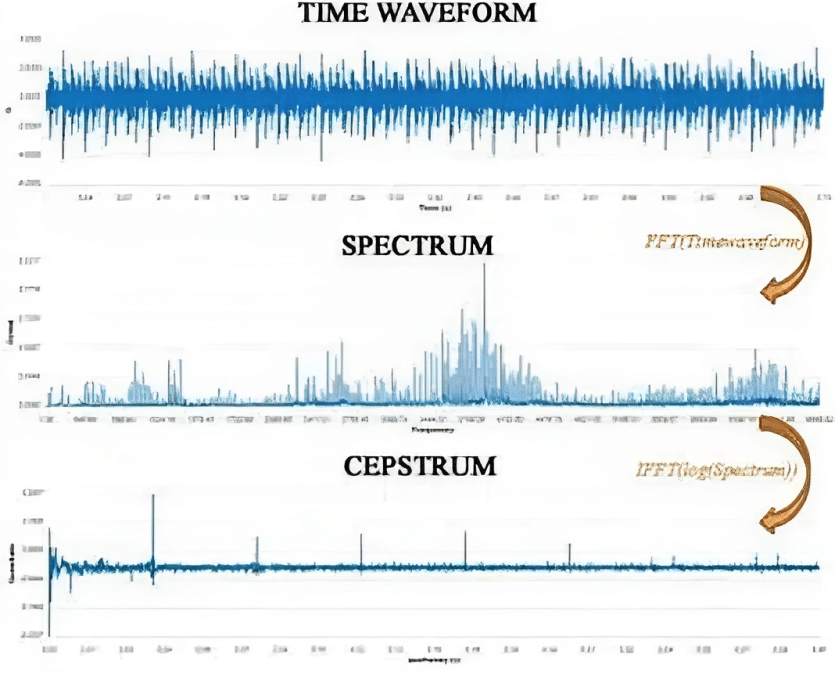

Fig. 1 Sensemore Cepstrum Dashboard
Case Study
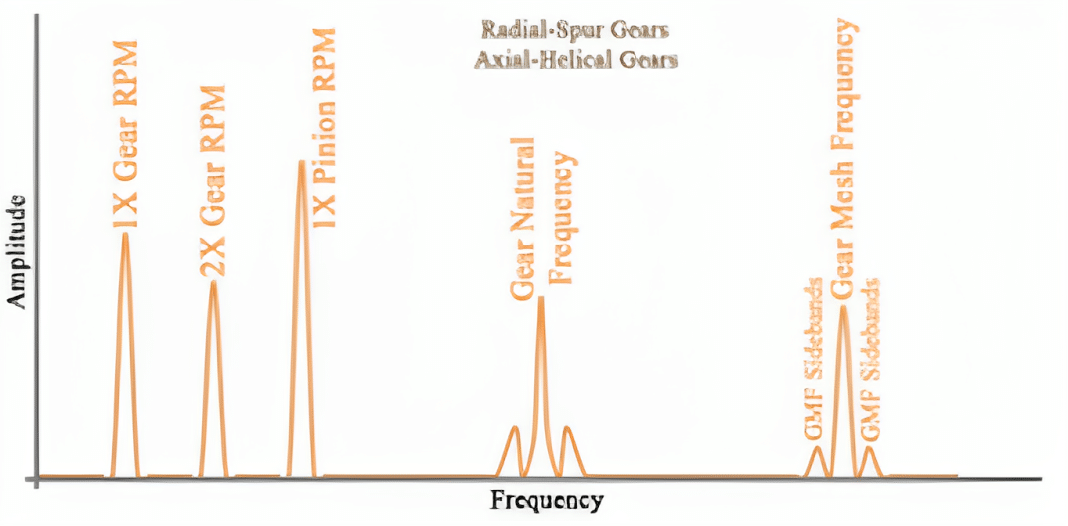
To better understand the process, let’s explain with an example. Suppose a 14-tooth pinion is attached to a motor rotating at 3000 RPM, and the pinion gear is turning the output gear, which has 42 teeth. In this case, the gear mesh frequency will be:
GMF = 3000 x 14 = 42000 RPM
Since sidebands will be produced at gear rotation speeds, sidebands are produced at 3000 RPM and 1000 RPM.

These sideband spacings that are produced in the cepstrum can be easily detected. The cepstrum has a horizontal axis with units of seconds. To determine the corresponding frequency, a 1/second calculation is made. The severity of the gear fault is directly proportional to the magnitude of the amplitudes in the cepstrum.

Conclusion
The cepstrum is affected by many factors such as noise level in the spectrum, filter bandwidth and shape, and sideband spacing. In the meantime, the cepstrum is a useful tool because changes in the spectrum are not immediately visible. It also provides a nice trend graph and alarm telemetry in condition monitoring systems, especially for gearbox conditions. Therefore, the cepstrum warns of upcoming malfunctions in advance and thus creates more time for planning maintenance outages. On the other hand, it constitutes a valuable diagnostic technique for detecting and improving modulation resources during the machine development phase.
Recommended Blog Posts
September 4, 2023
Powerful Signal Analysis Tools for Vibration Analysis
Predictive maintenance, crucial for machinery reliability, heavily relies on vibration analysis. Techniques like FFT…
September 4, 2023
Rotating Machinery Vibration Analysis
Vibration analysis is a critical tool in various industries like manufacturing, power generation, and transportation.…
December 28, 2022
Fault Diagnostic Technique Using Machine Mode Similarity Analysis
AI can diagnose machine faults with vibration data but machine mode similarity analysis is an alternative, it uses…
September 15, 2022
Understanding Rotating Machinery Data
Machine data is generated by physical attributes and actions of machines, collected by sensors and analyzed for…
August 6, 2021
Envelope Analysis
Bearings are critical elements in rotating machines, they support radial and axial loads, and reduce friction. Real…
October 9, 2020
How is Fault Detection Performed?
Vibration measurements and analysis, using multiple parameters, can identify developing problems in machinery before…
September 21, 2020
Parameter Selections in Vibration Measurement
Vibration measurements are used to determine the response of machines to forces and identify potential issues. It is…
September 4, 2020
What is Vibration Analysis?
Vibration analysis can be used to discover problems in machines and predict when they might fail. It can significantly…
Discover Our Products
Sensemore Predictive Maintenance Solution
If you enjoyed this blog, explore our Predictive Maintenance Solution page.


