Vibration Analysis is a crucial maintenance technique that employs sensors to measure equipment vibrations. It plays a vital role in maintenance planning as it aids in predicting potential equipment problems and ensuring asset reliability and availability. By analyzing vibration data, we can detect early signs of wear in rotating equipment, forecast faults, and avoid breakdowns. The key parameters used for these predictions are acceleration, speed, and displacement. For businesses interested in using advanced vibration analysis solutions, Sensemore Solutions offers state-of-the-art technology to predict and prevent equipment failures.
About Vibration Analysis
Vibration Analysis is a common monitoring technique used to detect wear signs and potential faults in rotating equipment. It focuses on identifying anomalies in machine vibrations and uses spectrum analysis for assessment.
Monitoring Techniques in Vibration Analysis
Several monitoring techniques are used in vibration analysis, with spectrum analysis being the most important. It helps identify significant frequencies from machine components by converting a signal from the time domain to the frequency domain using a Fast Fourier Transform (FFT).
Other techniques used in vibration analysis include:
- Discrete frequency monitoring: Measures the vibration level generated at specific component frequencies using FFT algorithms.
- Shock pulse monitoring: Specifically for rolling-element bearings, it monitors shocks and vibrations generated by these bearings for predictive maintenance.
- Kurtosis measurement: Used to monitor fatigue development in rolling bearings using simple instruments that measure the “spikedness” of a random signal.
- Signal averaging: Particularly useful for low-frequency measurements and gear monitoring related to rotational speed.
- Cepstrum analysis: Looks at repeated patterns in the spectrum and is used for analyzing interactions between rotational frequency of bladed rotors/blade passing frequency and gear tooth meshing frequencies/gear rotational speeds.
Interpreting Vibration Data
The interpretation of vibration data relies on three key parameters: acceleration, speed, and displacement. These parameters have different roles based on their application:
- Acceleration: Measures high frequencies and is often used with FFT to detect machine faults like misalignment or unbalance.
- Speed: Represents the destructive force and helps track changes in vibration intensity.
- Displacement: Useful for low-frequency measurements, providing insights into structural integrity and performance under real-world conditions.
Understanding these parameters gives valuable information about the condition of machines. For example, the overall level of vibration can indicate how rough a machine feels across a wide range of frequencies, especially for rotating machinery. The parameters affect how machines vibrate, while the amplitude represents the intensity of these vibrations. A high-amplitude frequency indicates strong vibration, while a low-amplitude suggests weaker vibration. Examining amplitudes across frequencies is often done to assess machine damage, as specific faults tend to show up at particular frequencies.
Real-time Insights with Vibration Analysis
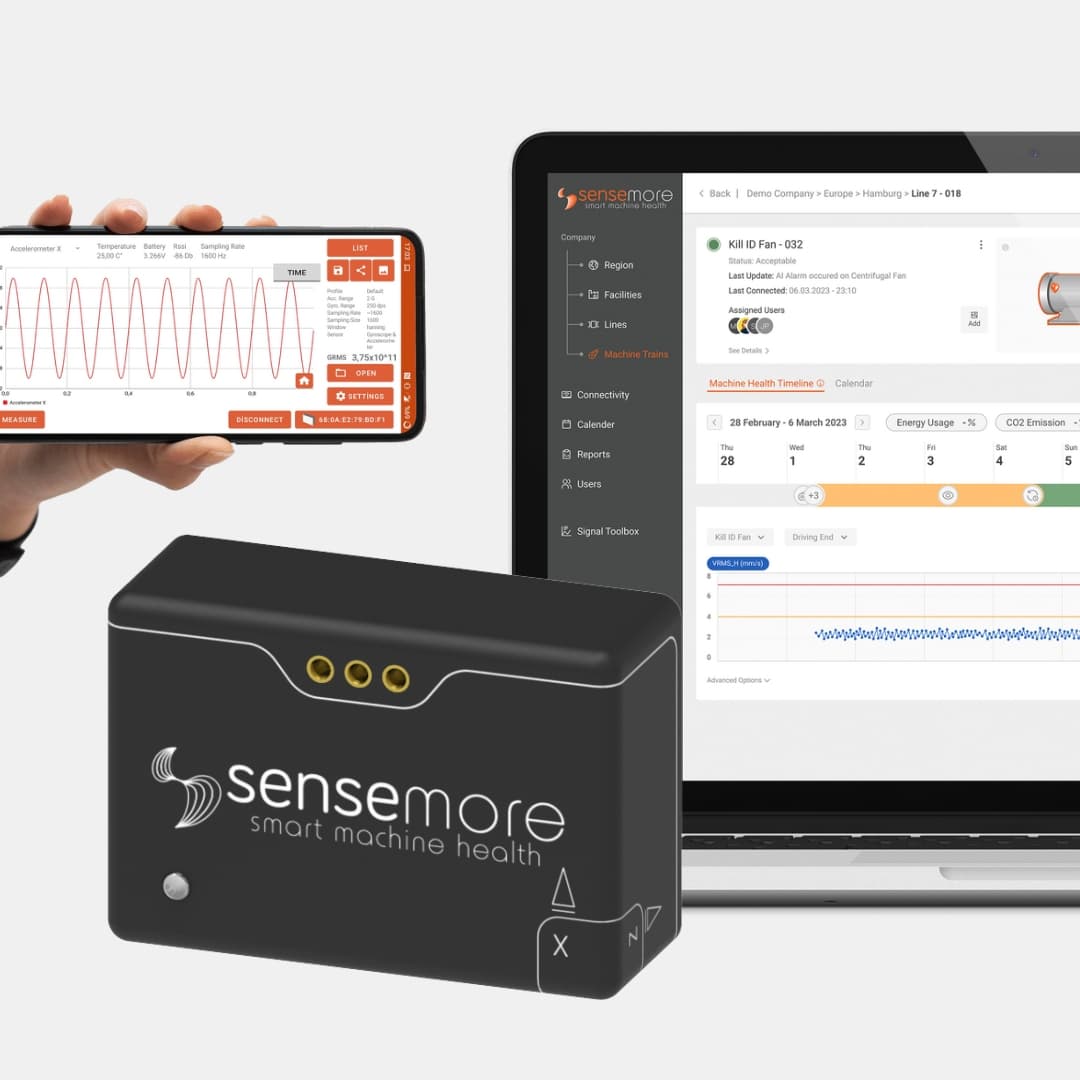
Vibration analysis offers immediate insights into machinery health and performance. With advanced condition monitoring solutions from Sensemore, you can prevent unplanned downtime and optimize equipment performance. Their data acquisition devices ensure reliable and accurate data collection for machine health applications. For example, the Sensemore Machine Health AI uses advanced analytics and machine learning to predict maintenance needs based on vibration analysis data, making this technique even more valuable.
Measurement Methods in Vibration Analysis
Vibration Analysis is an essential part of predictive maintenance. It involves using precise measurements of vibration to assess the condition of machinery. By detecting early signs of wear and predicting potential faults or failures, this technique plays a crucial role in ensuring the reliability of assets.
Key Measurement Devices:
Here are some common tools used in Vibration Analysis:
- Overall Level Meters: These instruments provide a quick snapshot of vibration by measuring the total energy within a wide frequency range. They are useful for initial assessments and can indicate if further analysis is required.
- Accelerometers: These devices are capable of capturing high-frequency vibrations and are essential for detecting defects in bearings and gears. They measure acceleration which can be integrated to derive velocity and displacement.
- Velocity Sensors: Often used to assess the severity of mechanical issues, these sensors focus on the speed of vibration. Velocity is directly related to the destructive forces at play within machinery components.
- Displacement Sensors: These sensors are critical when monitoring low-frequency vibrations such as those found in imbalance or misalignment. Displacement data reflects the physical movement of a machine part from its rest position.
Parameters and Their Significance:
Each measurement method is suitable for analyzing specific aspects of Vibration Analysis:
- Acceleration: Useful for high frequencies typically associated with bearing and gearbox faults.
- Speed: Correlates with the energy level of destructive forces, making it invaluable for evaluating machine condition.
- Displacement: Indicates actual movement amplitude at lower frequencies, crucial for detecting unbalance and misalignments.
The working principle of Vibration Analysis lies in capturing these parameters to construct an accurate portrayal of machinery health. Through sensors like accelerometers, velocity, and displacement detectors, maintenance professionals can discern abnormalities indicative of mechanical wear or imminent failure.
Advancements in Vibration Analysis:
Over time, Vibration Analysis has become widely adopted across various industries. This is due to advancements in sensor technology and data processing capabilities, which have improved the accuracy and speed of fault detection. Sensemore, for instance, offers a reliability-focused asset management platform with hardware, software, and AI-powered tools designed for machine health analysis.
Different Approaches in Vibration Analysis:
The implementation methods for Vibration Analysis can vary depending on the specific needs of an industry or organization:
- Direct Monitoring: Utilizing sensors attached to machinery components to capture real-time data.
- Portable Data Collection: Handheld devices periodically collect data from multiple points across machinery.
- Wireless Systems: Permanent sensors transmit data wirelessly for remote analysis and trending.
- Route-Based Monitoring: Scheduled measurements using portable equipment following established routes across plant facilities.
These methods empower maintenance teams to execute targeted interventions based on solid empirical evidence rather than relying solely on routine schedules or intuition. The transition from preventative to predictive maintenance via Vibration Analysis represents a paradigm shift towards a more efficient and cost-effective maintenance strategy.
Vibration Spectrum and Trends
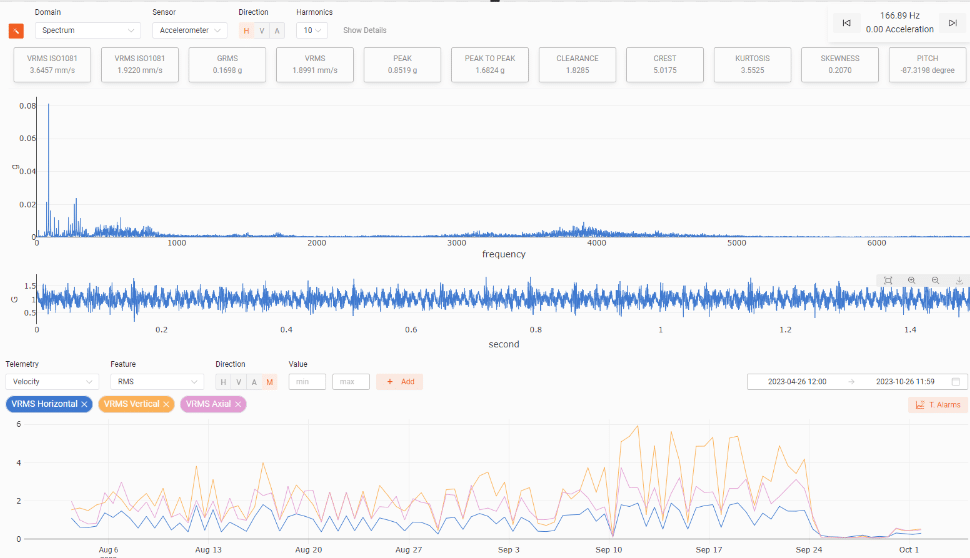
In vibration analysis, it’s important to realize that vibration measurement is not a standalone concept; it’s more like a mathematical expression. Mechanical vibrations can be measured in terms of position, velocity, or acceleration. Acceleration, measured in millimeters per second squared (mm/s²), is typically used for frequencies above 1000 Hz, while velocity, expressed in meters per second (m/s), is suitable for frequencies in the range of 10 Hz ≤ f ≤ 1000 Hz. For lower-frequency vibrations (below 10 Hz), position is the preferred unit, measured in microns.
As spectrum analysis is a specialized field, the common practice is to monitor vibration power using the root mean square (RMS) value. While it doesn’t provide all the details, it’s an effective way to track changes in vibration intensity. You can think of the RMS value as a representation of the vibration’s power distribution on the Frequency-Amplitude (RMS) graph.

Fig. 1 Vibration Spectrum and Trend Graphs
The Significance of Spectrum Analysis in Vibration Analysis
For vibration analysis, spectrum analysis plays a central role in unlocking the secrets of machine health and performance. To fully understand its importance, we need to navigate the intricacies of vibration signals, which are shaped by various forces and factors.
The Fourier Transform
Spectrum analysis relies on the transformative capability of the Fourier Transform. This mathematical tool is key to converting complex, time-based vibration signals into a harmonious world known as the frequency domain. Here, vibrations become distinct musical notes, forming frequency spectra that reveal a machine’s condition. Frequencies, much like the tempo in a musical composition, guide us through the machine’s vibrations. Amplitude, the partner of frequency, represents the intensity of vibration. While it can be measured in different units, it’s important to be aware of potential misinterpretations when using different software or products.
Common amplitude units include Peak-to-Peak, Peak, and RMS (Root Mean Square). Amplitude tells us how loud or soft a frequency is within the vibration spectrum, much like the volume of a musical note. A high-amplitude frequency indicates strong vibration, while a low-amplitude frequency suggests weaker vibration. Experts assess the severity of machine damage or defects by examining these amplitudes across frequencies.
Faults and Frequencies
Spectrum analysis reveals an interesting phenomenon – specific machine faults or defects manifest at particular frequencies, similar to signature melodies within the vibration spectrum. If left unaddressed, these “signature frequencies” increase in amplitude, resembling a musical note growing louder and more prominent.
Monitoring, Interpretation, and RMS
In practice, spectrum analysis involves careful monitoring of frequencies and amplitudes within the spectrum. This process is visualized through a Frequency-Amplitude graph, providing expert analysts with a canvas to spot irregularities and trends. It offers valuable insights into the overall health of the machine. At the core of this analysis is the root mean square (RMS) value. While it may not provide detailed information, it serves as a reliable way to track changes in vibration intensity. It quantifies the area beneath the Frequency-Amplitude (RMS) graph, a valuable tool for assessing the overall power of vibration.

Fig. 2 Frequency-Amplitude (RMS) graph
Benefits and Advantages of Implementing Vibration Analysis
Predictive Maintenance Capabilities
Vibration Analysis is a powerful tool for predictive maintenance. Instead of waiting for equipment to break down, predictive maintenance uses data to identify potential issues before they cause failures. This proactive approach helps in avoiding unplanned downtime.
By implementing Vibration Analysis, you can:
- Detect abnormalities in machine vibrations
- Analyze these abnormalities to predict future failures
- Plan and carry out necessary maintenance before the failure occurs
This early warning system significantly reduces unexpected downtime and allows for more efficient allocation of resources.
Improved Plant Efficiency
Vibration Analysis directly contributes to better plant efficiency by providing real-time insights into the health of machines. Regular monitoring helps in identifying potential problems early on, enabling timely maintenance instead of waiting for a breakdown.
The benefits of this approach include:
- Minimized downtime
- Extended lifespan of machinery
- Enhanced overall plant efficiency
Reduced Maintenance Costs
One of the key advantages of Vibration Analysis is its ability to save costs by optimizing maintenance activities. Traditional preventive maintenance often leads to unnecessary part replacements or premature servicing, resulting in higher expenses.
In contrast, predictive maintenance based on Vibration Analysis focuses only on components that show signs of impending failure. This targeted approach eliminates unnecessary replacements and reduces associated costs.
Thanks to early detection through Vibration Analysis:
Vibration Analysis offers significant benefits for maintenance operations:
- Enhances predictive maintenance capabilities, leading to reduced downtime
- Improves plant efficiency through real-time monitoring of machine health
- Reduces maintenance costs by focusing on critical components
By incorporating Vibration Analysis into your maintenance strategy, you can move beyond reactive approaches and embrace data-driven decision-making for better operational efficiency and cost savings.
Converting Vibration Data into Amplitude Units
Amplitude units measure the intensity of vibration signals and are vital for comparing data and assessing machine conditions.
Different Amplitude Units Used in Vibration Analysis:
- Peak-to-Peak measures the full range of waveform from its highest to lowest point, useful for detecting large displacements typically found in low-speed machinery.
- Peak values indicate the maximum positive or negative amplitude from the baseline and are critical for shock or transient events.
- RMS (Root Mean Square) offers an effective average vibration level over time, widely used for continuous monitoring due to its relevance to machine fatigue and potential damage.
Exploring Advanced Signal Processing Techniques
Advanced signal processing techniques extend beyond basic FFT analysis by utilizing sophisticated algorithms and methodologies to enhance fault detection and machinery analysis.
Examples of Advanced Signal Processing Techniques:
- Envelope Analysis: Detects subtle impacts and bearing defects by filtering out high-frequency noise.
- Order Analysis: Assesses vibrations on machines with variable speeds, quantifying changes relative to rotational speed.
- Cepstrum Analysis: Identifies repetitive patterns within frequency spectra that indicate specific mechanical interactions or faults.
Continuous Vibration Monitoring for Early Fault Detection
Continuous vibration monitoring represents a shift towards proactive maintenance practices. Real-time data collection allows for immediate action before faults escalate into failures.
Benefits of Continuous Vibration Monitoring:
- Structural Weakness Detection: Real-time monitoring identifies minute changes in vibration signatures that could indicate structural integrity issues. By addressing these early signs, technicians can reinforce structures before significant damage occurs.
- Lubrication Issue Identification: Inadequate lubrication often results in increased friction and wear. Continuous monitoring spots the characteristic vibrations caused by lubrication problems, guiding timely maintenance interventions.
- Operational Efficiency Improvement: By avoiding unplanned downtime through early fault detection, continuous monitoring contributes significantly to operational efficiency. It ensures machinery operates within optimal parameters, reducing energy consumption and wear-and-tear.
- Preventing Costly Equipment Damage: The costs associated with equipment failure extend beyond repairs. Lost production time, emergency maintenance resources, and secondary damage amplify expenses. Continuous monitoring serves as an insurance policy against these costs.
By implementing advanced vibration analysis techniques and continuous monitoring protocols, industries can expect substantial improvements in predictive maintenance strategies. This approach not only extends equipment life but also optimizes performance while minimizing maintenance-related expenditures.
Conclusion
Vibration Analysis: An essential part of digital maintenance. It improves asset management by giving early warnings of possible equipment failures, preventing unplanned downtime. By understanding important factors like acceleration, speed, and displacement, it helps us know the condition of machinery better.
Sophisticated Vibration Analysis solutions play a crucial role in modern asset management strategies. Specifically, Sensemore Solutions offers a complete approach to Vibration Analysis. Their solutions provide real-time information on equipment performance and allow for timely action before small issues become big problems.
Sensemore Solutions’ advanced technology turns raw vibration data into useful insights. It gives businesses the knowledge they need to make proactive decisions. This results in better plant efficiency, lower maintenance costs, and longer machine lifespan.
Using innovative Vibration Analysis solutions like these can bring significant benefits to businesses. They can make all the difference in staying competitive, where asset reliability and availability are key to success.
So, it’s wise to make advanced Vibration Analysis practices part of your maintenance routine. This will not only keep operations running smoothly but also protect your assets from unexpected breakdowns.
Recommended Blog Posts
September 4, 2023
Powerful Signal Analysis Tools for Vibration Analysis
Predictive maintenance, crucial for machinery reliability, heavily relies on vibration analysis. Techniques like FFT…
September 4, 2023
Rotating Machinery Vibration Analysis
Vibration analysis is a critical tool in various industries like manufacturing, power generation, and transportation.…
December 28, 2022
Fault Diagnostic Technique Using Machine Mode Similarity Analysis
AI can diagnose machine faults with vibration data but machine mode similarity analysis is an alternative, it uses…
September 15, 2022
Understanding Rotating Machinery Data
Machine data is generated by physical attributes and actions of machines, collected by sensors and analyzed for…
August 6, 2021
Envelope Analysis
Bearings are critical elements in rotating machines, they support radial and axial loads, and reduce friction. Real…
May 6, 2021
What is Cepstral Analysis?
Cepstral Analysis, a tool used to detect periodicity in frequency spectrum, can be useful in gearbox fault detection in…
October 9, 2020
How is Fault Detection Performed?
Vibration measurements and analysis, using multiple parameters, can identify developing problems in machinery before…
September 21, 2020
Parameter Selections in Vibration Measurement
Vibration measurements are used to determine the response of machines to forces and identify potential issues. It is…
Related Products
Sensemore Predictive Maintenance Solution
If you enjoyed this blog, explore our Predictive Maintenance Solution page.


