In mechanical systems, various parts of the same equipment can have different vibrations because of differences in their shapes, materials, and other factors. For example, in a conveyor system with an electric motor and a reducer, the vibrations in the reducer’s output shaft may be quite different from those of the electric motor when it runs at high frequencies. Using the same parameter selections in vibration measurement on both parts can lead to incorrect results.
The Role of Sample Size and Sampling Rate for Parameter Selections
In the process of turning an analog signal into a digital one (ADC), the size of the digital waveform’s samples is vital for accurately replicating the analog signal. Vibration measurements usually cover a period of time and are taken at regular intervals. The analog signal is transformed into digital format through samples taken at specific time intervals known as the sampling time (1/fs).
The number of samples taken each second is called the sampling rate or sampling frequency. It’s important to remember that the interval between periodic measurements is determined by dividing the sample size by the sampling frequency. Half of the sampling frequency (fs/2) is referred to as the Nyquist Frequency.
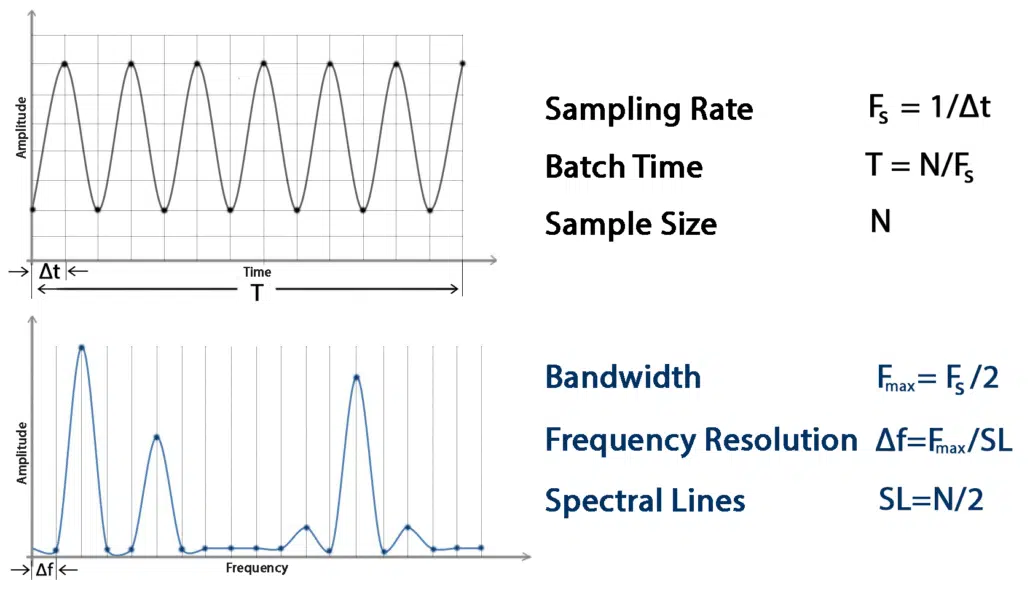
Fig. 1 Time and Frequency Domain Parameters
The Nyquist-Shannon Sampling Theorem
Analog signals consist of components at different frequencies. The highest-frequency component, denoted as fmax, defines the signal’s bandwidth. As per the Nyquist-Shannon Sampling Theorem, the sampling rate should be at least twice the highest frequency component in the analog signal, or 2×fmax. This theorem emphasizes the importance of understanding the implications of the sampling rate. When you follow this theorem before sampling an analog signal, the sampled signal accurately represents the analog signal, preserving all its information. However, if the sampling frequency falls below 2 times the highest frequency in the analog signal (fs<2×fmax), aliasing occurs. Aliasing hides high frequencies in the analog signal spectrum and can lead to misinterpretations of the signals produced by the vibration source.
Effect of Sampling Rate on Spectrum Bandwidth
Fig. 2 The Effect of Sampling Rate on Spectrum Bandwidth
If we do not follow the sampling theorem, a phenomenon called aliasing is going to occur. In case of aliasing, analog signals are transformed to digitals signals in a different way and this will prevent high frequencies to be appear in spectrum. Therefore, aliasing is an undesirable phenomenon in which digital signals are processed. All data collectors/analyzers have built-in sampling rates to avoid aliasing.
Theoretically, there should be no vibrations with a frequency more than half of this sampling rate. However, this can never be achieved in practice. That is why all analyzers have anti-aliasing filters. These are low-pass electronic filters that allow lower frequencies to pass but block higher ones. Filters eliminate all vibrations in an analog signal with frequencies greater than half the sampling rate. These filters automatically adjust to the appropriate values as the sampling frequency changes. This happens when the analyzer’s frequency range is changed by the user.
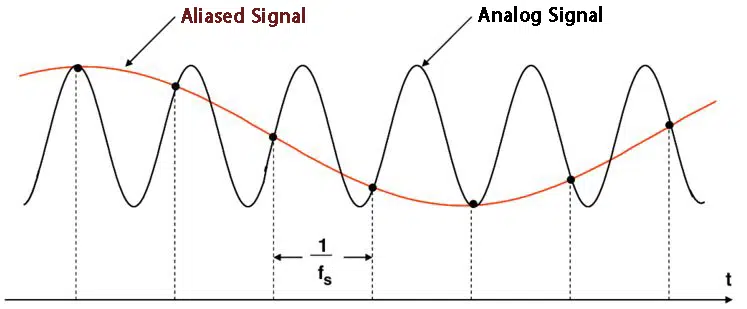
Fig. 3 Aliasing
Discrete Representation of Analog Signals
Many measurement systems designed for vibration signals use limited high-speed sampling rates, which can affect the accuracy of time signals generated. When the sampling frequency is much lower (e.g., 2.56 times lower) than the analog signal’s frequency, oversampling (e.g., 20 times) is often applied to compensate. Despite the lower sampling frequency, it’s crucial to understand that the signal still contains all the information found in the analog signal. While the signal may seem to jump between sampling points at a lower frequency, its integrity remains intact in the frequency domain. This means that a spectrum calculated from the signal remains accurate. The limitation imposed by the low sampling frequency primarily affects the time-based representation of the signal, not the frequency-based one.
Impact of Sampling Rate on Signal Representation
When the sampling rate falls below the required threshold (fs<2×fmax), aliasing occurs, distorting the signal’s integrity. This means that high-frequency components in the analog signal may not appear correctly in the digital representation. Aliasing is a phenomenon we want to avoid to obtain accurate vibration measurements.
Selecting the Right Dynamic Range
Aside from sampling rate, another crucial aspect to consider is the dynamic range when measuring vibration. Dynamic range refers to the ability of the measurement system to capture a wide range of vibration amplitudes accurately. Different machinery and applications exhibit varying levels of vibration intensity.
To illustrate the importance of dynamic range, consider a scenario where you’re measuring vibrations from a machine. In some cases, these vibrations may be relatively small, akin to a gentle hum, and fall within a low range (e.g., 2G). However, in other instances, the vibrations might be much more intense, resembling powerful jolts, necessitating a higher dynamic range (e.g., 8G or 16G).
The Consequences of Choosing the Wrong Dynamic Range
If you opt for a dynamic range that’s too limited for the actual vibration amplitudes, you risk “clipping” the data. In simpler terms, you’ll lose information about the vibration’s actual intensity, like trying to capture the roar of a lion with a microphone that can only pick up whispers.
On the other hand, selecting an overly wide dynamic range for relatively low-intensity vibrations can lead to a decrease in sensitivity. It’s akin to using a microscope to read large print; you may miss finer details.
Automatic Adjustment of Anti-Aliasing Filters
To mitigate the challenges posed by aliasing due to insufficient sampling rates, most data collectors and analyzers incorporate anti-aliasing filters. These filters automatically adapt to changes in the sampling frequency, preventing aliasing and ensuring data integrity.

Fig. 4 Anti-aliasing filter operation
References
- C. Scheffer, P. GirdharMachinery Vibration Analysis & Predictive Maintenance(Oxford:Elsevier, 2004)
- A. Brandt, Noise and Vibration Analysis(New Delhi: Wiley, 2011)
- Bertoletti, 2020, Nyquist-Shannon Sampling Theorem
Recommended Blog Posts

Powerful Signal Analysis Tools for Vibration Analysis
Predictive maintenance, crucial for machinery reliability, heavily relies on vibration analysis. Techniques like FFT…

Rotating Machinery Vibration Analysis
Vibration analysis is a critical tool in various industries like manufacturing, power generation, and transportation.…
Fault Diagnostic Technique Using Machine Mode Similarity Analysis
AI can diagnose machine faults with vibration data but machine mode similarity analysis is an alternative, it uses…

Understanding Rotating Machinery Data
Machine data is generated by physical attributes and actions of machines, collected by sensors and analyzed for…

Envelope Analysis
Bearings are critical elements in rotating machines, they support radial and axial loads, and reduce friction. Real…

What is Cepstral Analysis?
Cepstral Analysis, a tool used to detect periodicity in frequency spectrum, can be useful in gearbox fault detection in…

How is Fault Detection Performed?
Vibration measurements and analysis, using multiple parameters, can identify developing problems in machinery before…

What is Vibration Analysis?
Vibration analysis can be used to discover problems in machines and predict when they might fail. It can significantly…

Sensemore Predictive Maintenance Solution
If you enjoyed this blog, explore our Predictive Maintenance Solution page.