As a result of targeting more reliable and more sustainable factories by reducing the need for human resources, the increasing needs of the industry, and the costs caused by these needs, topics like machine health and predictive maintenance maintain their place among the rising trends of the agenda. The maintenance costs and loss of profit that an unplanned downtime on the production line will cause to the manufacturer can be prevented by monitoring the health of the machines on this line. In this context, investments in predictive maintenance return with the early detection of possible malfunctions.
There are several analysis techniques for monitoring machine health. The most popular among them are vibration analysis, oil analysis, ultrasound analysis, and electrical signature analysis (ESA). The diversity of these techniques allows higher accuracy in the diagnosis of possible malfunctions. While some types of faults can be detected better by vibration analysis, other types are better detected by electrical signature analysis. For instance, electrical signature analysis is used in the detection of broken bar failure, which is the most common rotor failure. Electrical signature analysis can also be an alternative to vibration analysis for misalignment faults.
With electrical signature analysis, faults such as stator faults, rotor faults, bearing faults, and load-induced faults can be detected in advance.
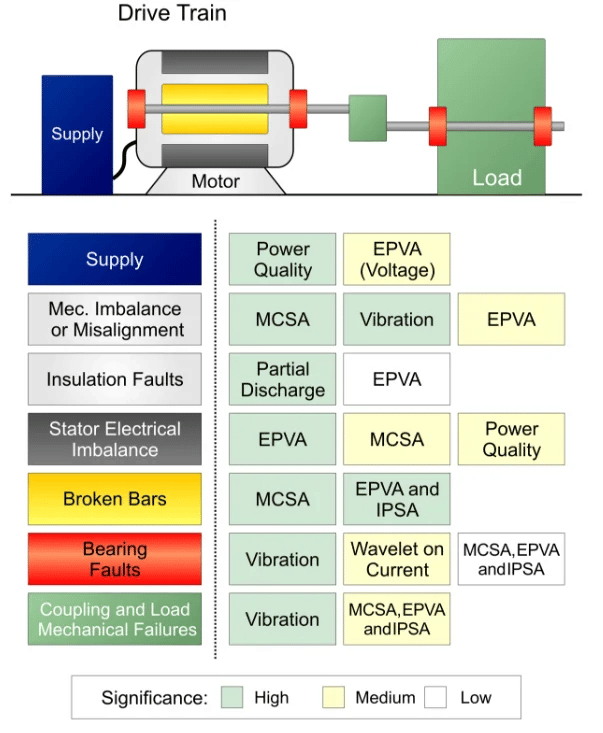
Fig. 1 Faults Detected by Different Methods
Electrical Signature Analysis (ESA)
Electrical signature analysis is an umbrella term covering some machine condition monitoring methods that are accomplished by analyzing electrical signals such as current and voltage. Some of these techniques include current signature analysis, voltage signature analysis, Park’s Vector approach, and instantaneous power signature analysis. As a result of these analyses, reduction in downtime, increase in machine availability, reduction in maintenance costs, and better management and planning of maintenance are expected.
With the remote monitoring provided in facilities where electrical signature analysis is applied, the hazards that personnel may encounter physically while monitoring equipment health are prevented. Electrical signature analysis allows the health of any asynchronous motor to be monitored and possible failures to be detected beforehand, without power restrictions. It offers sensitivity in detecting mechanical faults in motors and loads, electrical faults in stators, and network problems.
Obtaining the Data
Electrical signature analysis does not require sensors mounted on the rotating driveline of the machines. Since the data to be monitored are current and voltage, these measurements can be taken from the phase cables at the motor input. In the motor control center (panel), the phase cables from the driver output to the motor input related to the equipment to be monitored can be detected, and current and voltage signals can be obtained with the analog output sensors positioned on these cables. Then, by transferring these data to an analyzer or a cloud analysis software via IoT data acquisition devices, the data can be analyzed, and possible malfunctions can be detected.
The demands of measurement are precision, accuracy/linearity, high bandwidth, and low power consumption. To display the current data, sensors that reduce the motor current to the input range value of the data collection devices should be used. Sensors such as current transformers, Rogowski coils, shunt and trace resistors, Hall-effect sensors, and fluxgate sensors can be used. For voltage measurements, the voltage level is reduced to the appropriate range that analog data acquisition devices can detect with sensors such as voltage/potential transformers and voltage dividers.
The techniques that make up the electrical signature analysis are used to interpret the obtained data.
Motor Current Signature Analysis (MCSA)
MCSA is a method for analyzing and tracking the health of the electrical machine and for detecting possible malfunctions in the near future with their root causes. It aids in the identification of stator winding issues, rotor issues, coupling issues, load issues, efficiency issues, and bearing issues.
This method employs an asynchronous motor as a transducer, allowing the user to assess the electrical and mechanical conditions. Current signals are taken from the motor and then collected by a data acquisition device. After that, the signals are conditioned, and the spectrum of the signal is obtained. These spectra are analyzed to detect any matches with fault patterns.

Fig. 2 Monitoring System for Motor Current Signature Analysis
The spectrum of the motor current interprets the frequency components of the current signal with their respective magnitudes. In other words, it is the expression of the time waveform signal in the frequency domain. This allows patterns in the current signature to be identified, distinguishing healthy motors from unhealthy motors, and even determining which component of the machine may fail. The Fast Fourier Transform (FFT) is the main instrument in this investigation.
Voltage Signature Analysis (VSA)
The Voltage Signature Analysis is quite similar to the motor current signature analysis; however, the signal is collected from the motor’s voltage source. It can be beneficial in the examination of stator electrical imbalance along with the analysis of the current signature and the issues caused by motor power in the case of motors. This method is most typically utilized in the analysis of production units.
Instantaneous Power Signature Analysis (IPSA)
Another failure analysis approach based on spectral analysis is instantaneous power analysis. It differentiates from MCSA and VSA in that it evaluates the information contained in the voltage and current signals of a motor phase together, and the demodulated fault component is named Characteristic Frequency.
The spectrum of the instantaneous power has an extra component linked to the modulation induced by the fault, in addition to the fundamental component and sidebands to be formed. This component is known as the Characteristic Component, and it may be used for diagnosing the machine’s status.
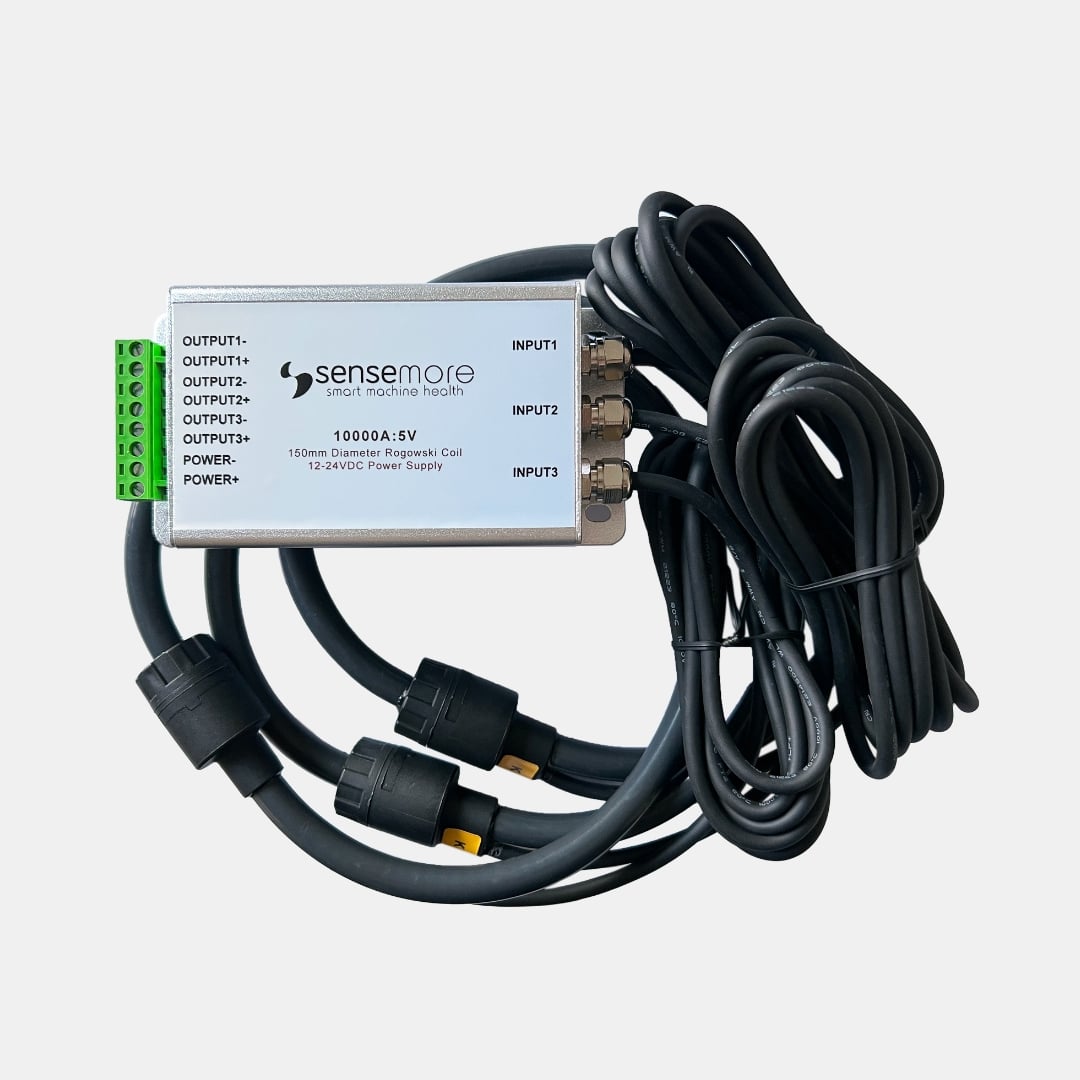
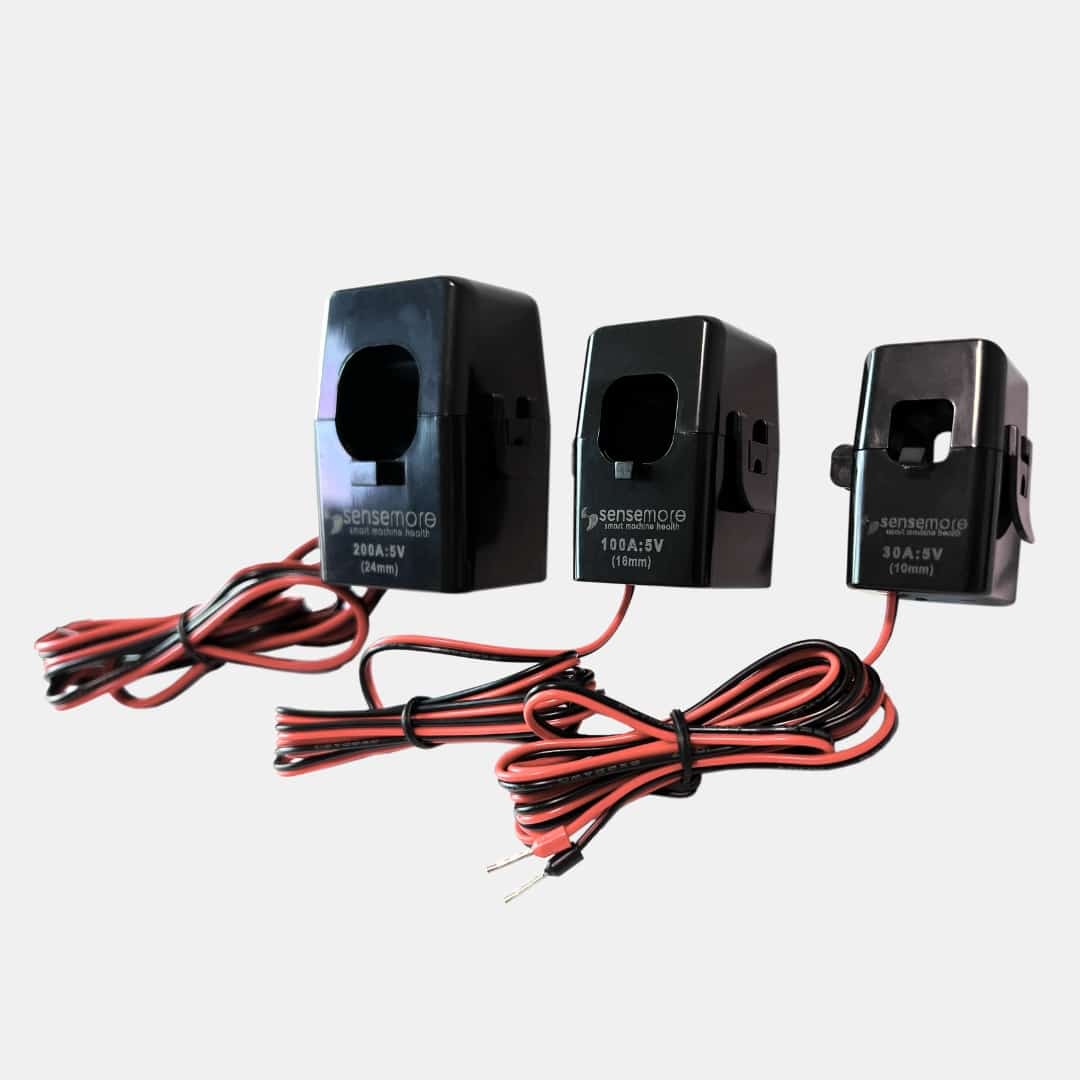
For electrical signature analysis, Sensemore offers its customers split-core current transformers, Rogowski coils for motors with high currents, and voltage divider sensors to measure voltage values. These are easily placed on the motor phase cables in the electrical control center (panel), and the current-voltage data is transferred to the Duck device. Duck transfers this data to the Sensemore Cloud Application. Thanks to the software in the Cloud Application, this data is analyzed, reports are created for the user about possible failures, and energy monitoring is provided.
It is a well-known fact that unexpected downtimes of machines in the industry and disruption of the production processes cost a fortune. Specific maintenance strategies have been implemented in the industry to prevent these downtimes. Some of these strategies are centered on the regular maintenance of the machine at certain periods. However, this kind of strategy reduces the efficiency of the production process by taking the machine into maintenance even if the machine is working in a healthy condition, or when there is no possible malfunction. That is where electrical signature analysis comes into play.
Condition Monitoring Techniques
Condition monitoring-based predictive maintenance, which is one of the maintenance strategies developed for maximizing the efficiency to be obtained from the machine during the production process, has recently come to the fore with the increasing popularity of digitalization and sustainability topics. Condition monitoring enables one to conclude about the current health status of the machine by taking certain data (vibration, current, voltage, temperature, etc.) from the machine and analyzing them. The point where predictive maintenance comes into play is to provide information about the malfunctions that may occur in the machine in the near future and their root causes by tracking and analyzing the data obtained and the results obtained with condition monitoring over time.

Fig. 1 Potential Failure – Functional Failure Curve
The initial phase in condition monitoring is basic inspections. Small changes, such as abnormal heat or pressure, strange noises, excessive vibration, or a particular odor, are typically signs that something isn’t working properly. All techniques of condition monitoring are employed in a large variety of systems, from the most basic checks to cutting-edge tools. There are several condition monitoring techniques, and each is tailored to a particular machine component. When checking the state of various points of the machines, it is important to choose and apply the proper condition monitoring techniques according to the point to be applied since different forms of failure can be detected by different condition monitoring techniques.
In addition to electrical signature analysis, there are condition monitoring methods such as oil analysis, ultrasound analysis, infrared thermography, and acoustic emission analysis. Each of them has a different capacity to detect malfunctions that may occur in the machine a while ago. For example, oil analysis and ultrasound techniques can predict possible malfunctions earlier than vibration and electrical signature analysis methods, even when the machine is in good condition and shows no visible signs of malfunction.
As the fault progresses in the machine, the repair of the fault becomes costlier and requires more time. This means more unexpected downtime. On the other hand, the condition monitoring method to be applied should be an economical solution. Since the measurement devices and applications required for condition monitoring with the mentioned oil and ultrasound analysis methods are costly, their application may not be possible everywhere. Besides, each method is specialized in finding certain failure modes. Therefore, vibration analysis and electrical signature analysis methods, which have a wider scope and application, have found more places in predictive maintenance applications.
The Aspects of Electrical Signature Analysis that Differ from the Other Methods
Forty-one percent of asynchronous motor failures are caused by the bearings, 37 percent by the stators, and 10 percent by the rotors. Although bearing failures can be detected more clearly with vibration analysis, they can also be detected by electrical signature analysis. On the other hand, in asynchronous motors, especially in stator and rotor faults, electrical signature analysis provides a very clear detection and is a very powerful and economical solution compared to other methods.
Mechanical misalignment or unbalance, and air gap misalignment can be detected by both electrical signature analysis and vibration analysis. Failures caused by motor supply and insulation problems can be detected by electrical signature analysis. Electrical signature analysis is much more powerful than other detection methods in detecting broken rotor bars and stator problems.
Since each condition monitoring method can analyze the health status of different parts of the machine, and detect possible faults that may occur in these parts with their root causes, increasing the application of these methods enables the detection of faults in a wider range. Since electrical signature analysis is easy to implement, it can be easily preferred instead of or alongside other condition monitoring methods.

Fig. 2 Motor Control Center (MCC)
Unlike other condition monitoring methods, electrical signature analysis is not dependent on machine operating conditions to collect data. Because the sensors to collect the data are not applied directly to the machine, but in the cells called the motor control center (MCC) or the panel where the electrical connections of the machine are made. Here, the current and voltage values of the motor are measured by attaching current and voltage sensors to the cables feeding the motor. Since the ambient conditions in the motor control center are generally the same, measurements can be taken continuously, and the data can be analyzed uninterruptedly.
Since current and voltage data are very clear information, these data can be easily obtained accurately by applying economic solutions with basic measurement methods. Making sense of data is also easier compared to other condition monitoring methods. By analyzing the data in the frequency space, the presence of the fault can be detected by the formation of sideband components with equal frequency intervals to be formed around a fundamental frequency (motor driving frequency). The harmonics of the sidebands can also be observed. The main part where electrical signature analysis differs from vibration analysis is that harmonic frequency components in multiples of the fundamental frequency are observed in vibration analysis, while electrical signature analysis observes sidebands and sometimes sideband harmonics.
Including Electrical Signature Analysis in Condition Monitoring Strategies
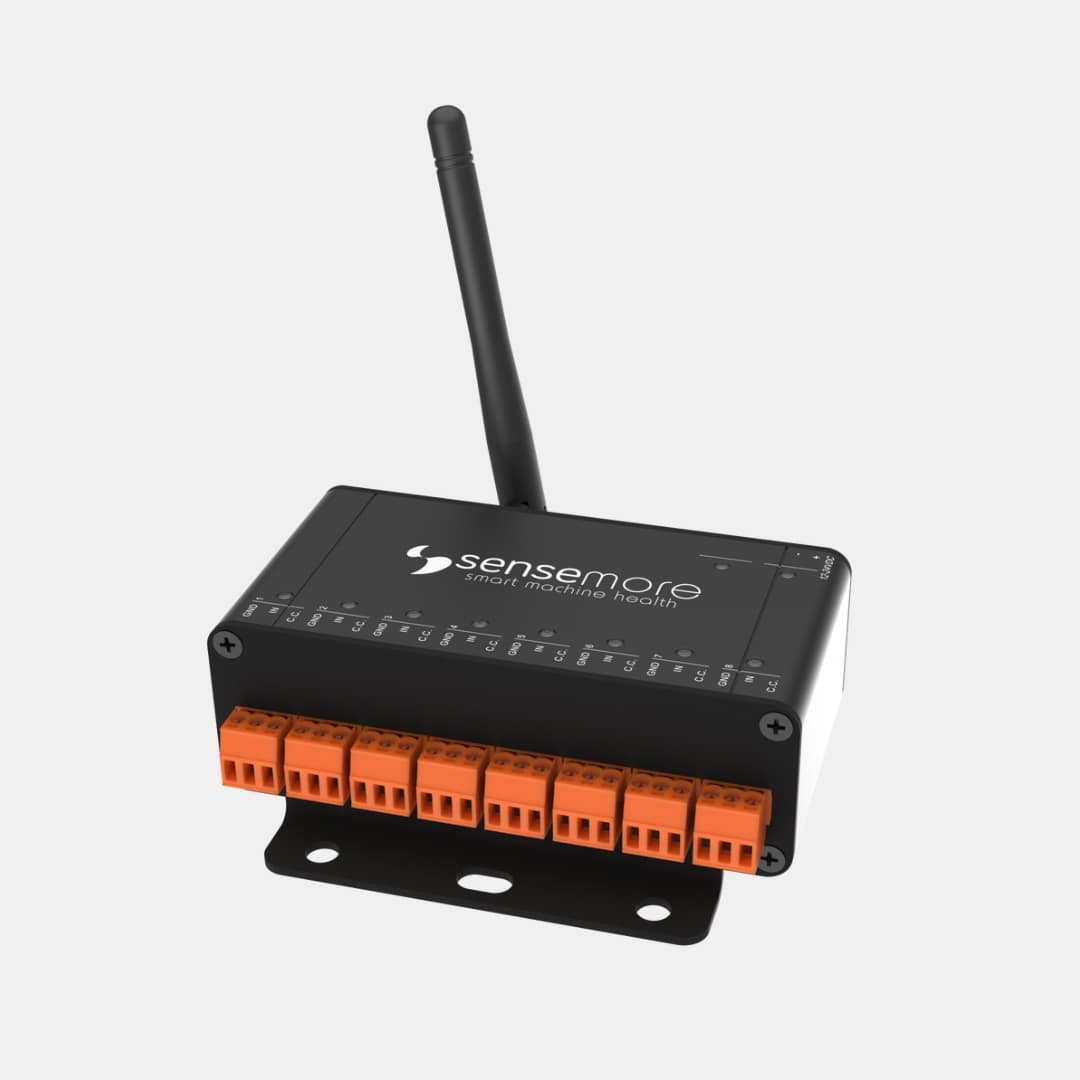
In addition to collecting and analyzing vibration data with vibration and temperature sensors, Sensemore also collects and analyzes electrical data with current/voltage sensors and the IoT data collection device Duck. There are 8 different channels for Duck to collect data from different sensors simultaneously and transfer it to the cloud. Three-phase current and three-phase voltage information in motors can be collected simultaneously using 6 of these channels. In this way, methods such as motor current signature analysis (MCSA), voltage signature analysis (VSA), and instantaneous power signature analysis (IPSA), among the techniques included in the electrical signature analysis, can be applied.
Current and voltage data are taken from the phase cables feeding the motor via sensors and transmitted to Duck. Duck transfers this data wirelessly to the cloud. Data can be viewed and analyzed via the cloud application. Possible malfunctions that may occur in the machine are notified to the users in advance, ensuring that users can take action before unexpected stoppages occur.

Fig. 3 Application of Electrical Signature Analysis
Conclusion
Electrical signature analysis has an important role in detecting possible failures. In order to detect these failures, the data must be obtained correctly and in sufficient quantity, then analyzed. Sensemore offers its customers the Duck solution, an IoT data acquisition device, to collect and transfer the data to the analysis software. With its 8 channels, the Duck device can take manual, periodic, and triggered measurements simultaneously from 8 different analog output sensors. Analog sensors such as current, voltage, temperature, vibration, humidity, pressure, etc., can be connected to these channels, and the measurements can be viewed in the Sensemore Cloud App.
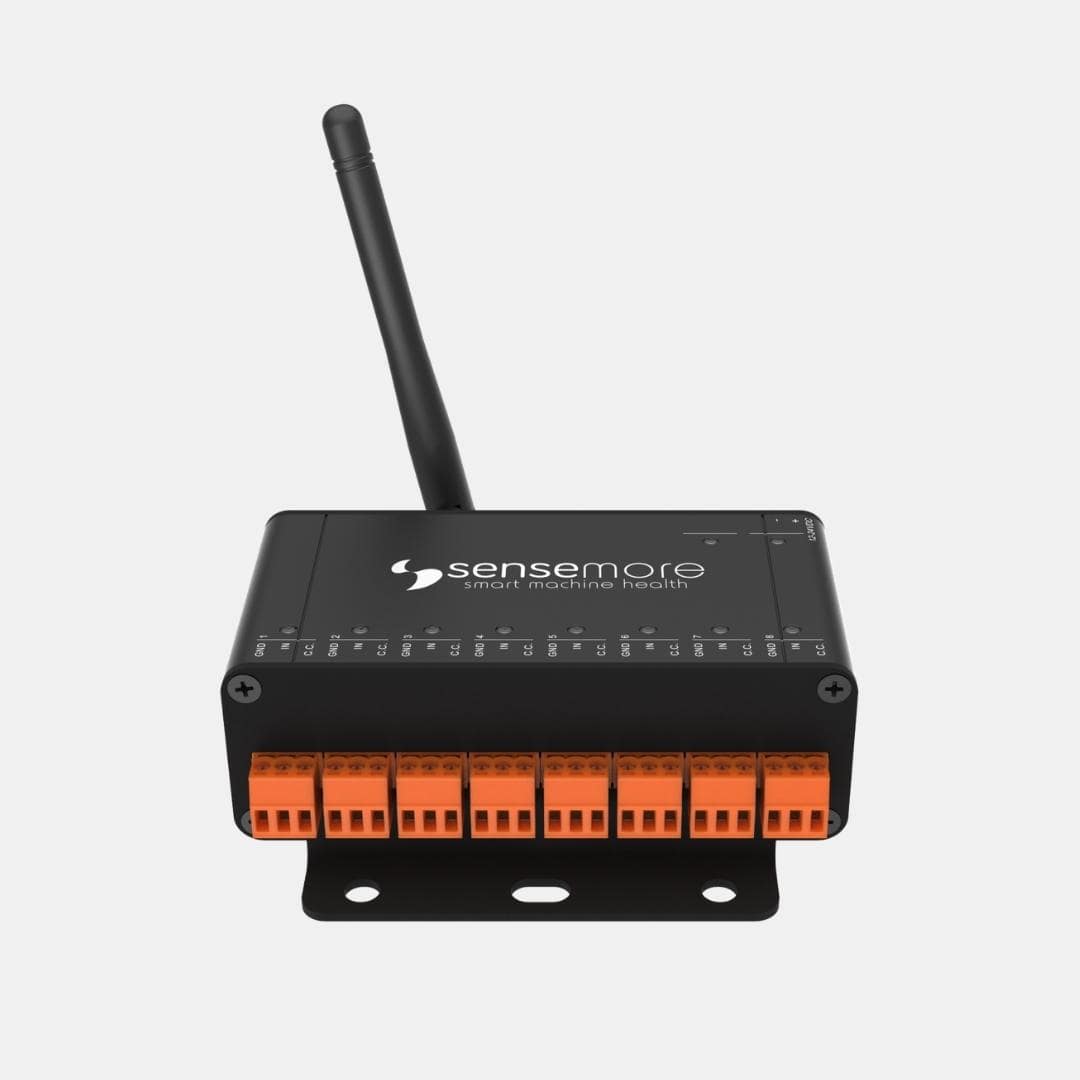
Fig. 4 Analog IoT Data Acquisition Device: Duck
References:
- Bonaldi, E. L., de Oliveira, L. E. D. L., da Silva, J. G. B., Lambert-Torresm, G., & da Silva, L. E. B. (2012). Predictive Maintenance by Electrical Signature Analysis to Induction Motors.
- World Economic Forum, Analysis: Global CO2 emissions from fossil fuels hits record high in 2022.
United States Environmental Protection Agency, Sources of Greenhouse Gas Emissions
Recommended Blog Posts
September 4, 2023
Powerful Signal Analysis Tools for Vibration Analysis
Predictive maintenance, crucial for machinery reliability, heavily relies on vibration analysis. Techniques like FFT…
September 4, 2023
Rotating Machinery Vibration Analysis
Vibration analysis is a critical tool in various industries like manufacturing, power generation, and transportation.…
December 28, 2022
Fault Diagnostic Technique Using Machine Mode Similarity Analysis
AI can diagnose machine faults with vibration data but machine mode similarity analysis is an alternative, it uses…
September 15, 2022
Understanding Rotating Machinery Data
Machine data is generated by physical attributes and actions of machines, collected by sensors and analyzed for…
August 6, 2021
Envelope Analysis
Bearings are critical elements in rotating machines, they support radial and axial loads, and reduce friction. Real…
May 6, 2021
What is Cepstral Analysis?
Cepstral Analysis, a tool used to detect periodicity in frequency spectrum, can be useful in gearbox fault detection in…
October 9, 2020
How is Fault Detection Performed?
Vibration measurements and analysis, using multiple parameters, can identify developing problems in machinery before…
September 21, 2020
Parameter Selections in Vibration Measurement
Vibration measurements are used to determine the response of machines to forces and identify potential issues. It is…
September 4, 2020
What is Vibration Analysis?
Vibration analysis can be used to discover problems in machines and predict when they might fail. It can significantly…
Related Products
Sensemore Predictive Maintenance Solution
If you enjoyed this blog, explore our Predictive Maintenance Solution page.


